Did You Participate In Any Of OneMain Holdings' (NYSE:OMF) Fantastic 273% Return ?
The worst result, after buying shares in a company (assuming no leverage), would be if you lose all the money you put in. But on the bright side, you can make far more than 100% on a really good stock. One great example is OneMain Holdings, Inc. (NYSE:OMF) which saw its share price drive 167% higher over five years. On top of that, the share price is up 14% in about a quarter. But this move may well have been assisted by the reasonably buoyant market (up 8.1% in 90 days).
See our latest analysis for OneMain Holdings
There is no denying that markets are sometimes efficient, but prices do not always reflect underlying business performance. By comparing earnings per share (EPS) and share price changes over time, we can get a feel for how investor attitudes to a company have morphed over time.
During the last half decade, OneMain Holdings became profitable. Sometimes, the start of profitability is a major inflection point that can signal fast earnings growth to come, which in turn justifies very strong share price gains. Given that the company made a profit three years ago, but not five years ago, it is worth looking at the share price returns over the last three years, too. We can see that the OneMain Holdings share price is up 85% in the last three years. Meanwhile, EPS is up 60% per year. This EPS growth is higher than the 23% average annual increase in the share price over the same three years. So you might conclude the market is a little more cautious about the stock, these days. This unenthusiastic sentiment is reflected in the stock's reasonably modest P/E ratio of 7.43.
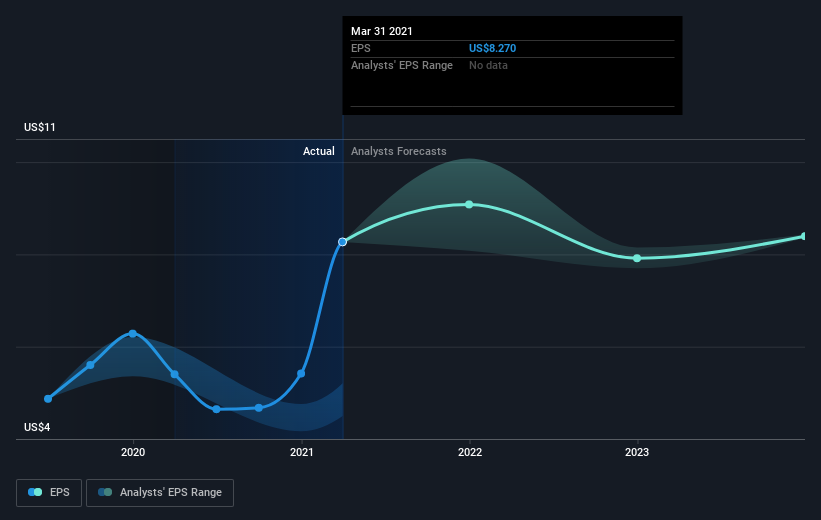
You can see how EPS has changed over time in the image below (click on the chart to see the exact values).
We know that OneMain Holdings has improved its bottom line over the last three years, but what does the future have in store? You can see how its balance sheet has strengthened (or weakened) over time in this free interactive graphic.
What About Dividends?
As well as measuring the share price return, investors should also consider the total shareholder return (TSR). The TSR is a return calculation that accounts for the value of cash dividends (assuming that any dividend received was reinvested) and the calculated value of any discounted capital raisings and spin-offs. So for companies that pay a generous dividend, the TSR is often a lot higher than the share price return. In the case of OneMain Holdings, it has a TSR of 273% for the last 5 years. That exceeds its share price return that we previously mentioned. This is largely a result of its dividend payments!
A Different Perspective
It's nice to see that OneMain Holdings shareholders have received a total shareholder return of 209% over the last year. Of course, that includes the dividend. That gain is better than the annual TSR over five years, which is 30%. Therefore it seems like sentiment around the company has been positive lately. In the best case scenario, this may hint at some real business momentum, implying that now could be a great time to delve deeper. I find it very interesting to look at share price over the long term as a proxy for business performance. But to truly gain insight, we need to consider other information, too. Take risks, for example - OneMain Holdings has 3 warning signs (and 2 which shouldn't be ignored) we think you should know about.
But note: OneMain Holdings may not be the best stock to buy. So take a peek at this free list of interesting companies with past earnings growth (and further growth forecast).
Please note, the market returns quoted in this article reflect the market weighted average returns of stocks that currently trade on US exchanges.
This article by Simply Wall St is general in nature. It does not constitute a recommendation to buy or sell any stock, and does not take account of your objectives, or your financial situation. We aim to bring you long-term focused analysis driven by fundamental data. Note that our analysis may not factor in the latest price-sensitive company announcements or qualitative material. Simply Wall St has no position in any stocks mentioned.
Have feedback on this article? Concerned about the content? Get in touch with us directly. Alternatively, email editorial-team (at) simplywallst.com.
