How Did Tarena International Inc’s (NASDAQ:TEDU) 11.17% ROE Fare Against The Industry?

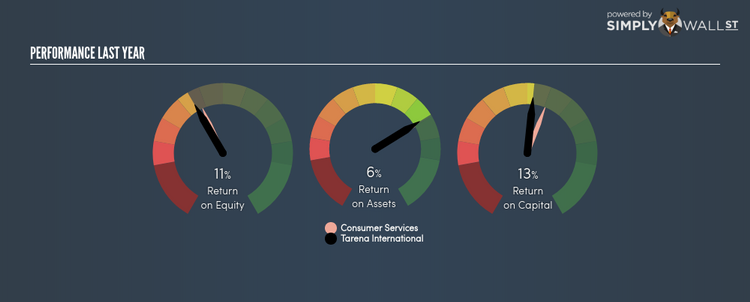
Tarena International Inc (NASDAQ:TEDU) generated a below-average return on equity of 11.17% in the past 12 months, while its industry returned 12.10%. TEDU’s results could indicate a relatively inefficient operation to its peers, and while this may be the case, it is important to understand what ROE is made up of and how it should be interpreted. Knowing these components could change your view on TEDU’s performance. Today I will look at how components such as financial leverage can influence ROE which may impact the sustainability of TEDU’s returns. See our latest analysis for Tarena International
Breaking down Return on Equity
Return on Equity (ROE) weighs Tarena International’s profit against the level of its shareholders’ equity. For example, if the company invests $1 in the form of equity, it will generate $0.11 in earnings from this. While a higher ROE is preferred in most cases, there are several other factors we should consider before drawing any conclusions.
Return on Equity = Net Profit ÷ Shareholders Equity
ROE is assessed against cost of equity, which is measured using the Capital Asset Pricing Model (CAPM) – but let’s not dive into the details of that today. For now, let’s just look at the cost of equity number for Tarena International, which is 8.96%. While Tarena International’s peers may have higher ROE, it may also incur higher cost of equity. An undesirable and unsustainable practice would be if returns exceeded cost. However, this is not the case for Tarena International which is encouraging. ROE can be dissected into three distinct ratios: net profit margin, asset turnover, and financial leverage. This is called the Dupont Formula:
Dupont Formula
ROE = profit margin × asset turnover × financial leverage
ROE = (annual net profit ÷ sales) × (sales ÷ assets) × (assets ÷ shareholders’ equity)
ROE = annual net profit ÷ shareholders’ equity
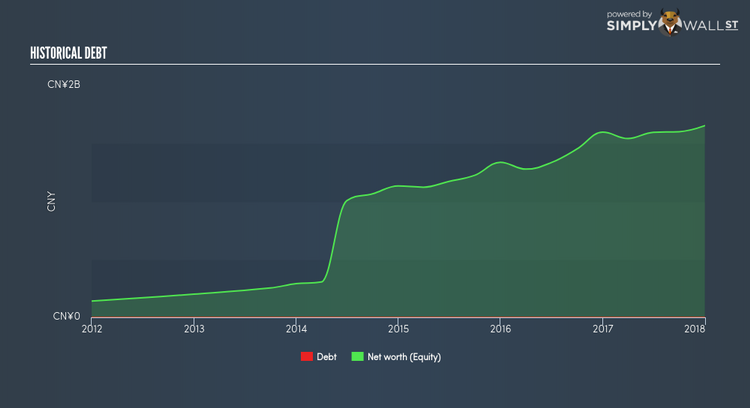
Essentially, profit margin shows how much money the company makes after paying for all its expenses. Asset turnover shows how much revenue Tarena International can generate with its current asset base. And finally, financial leverage is simply how much of assets are funded by equity, which exhibits how sustainable the company’s capital structure is. Since ROE can be inflated by excessive debt, we need to examine Tarena International’s debt-to-equity level. Currently, Tarena International has no debt which means its returns are driven purely by equity capital. This could explain why Tarena International’s’ ROE is lower than its industry peers, most of which may have some degree of debt in its business.
Next Steps:
ROE is a simple yet informative ratio, illustrating the various components that each measure the quality of the overall stock. Even though Tarena International returned below the industry average, its ROE comes in excess of its cost of equity. Its appropriate level of leverage means investors can be more confident in the sustainability of Tarena International’s return with a possible increase should the company decide to increase its debt levels. Although ROE can be a useful metric, it is only a small part of diligent research.
For Tarena International, there are three key factors you should look at:
Financial Health: Does it have a healthy balance sheet? Take a look at our free balance sheet analysis with six simple checks on key factors like leverage and risk.
Valuation: What is Tarena International worth today? Is the stock undervalued, even when its growth outlook is factored into its intrinsic value? The intrinsic value infographic in our free research report helps visualize whether Tarena International is currently mispriced by the market.
Other High-Growth Alternatives : Are there other high-growth stocks you could be holding instead of Tarena International? Explore our interactive list of stocks with large growth potential to get an idea of what else is out there you may be missing!
To help readers see pass the short term volatility of the financial market, we aim to bring you a long-term focused research analysis purely driven by fundamental data. Note that our analysis does not factor in the latest price sensitive company announcements.
The author is an independent contributor and at the time of publication had no position in the stocks mentioned.
