Does Arcadis NV’s (AMS:ARCAD) Recent Track Record Look Strong?

Assessing Arcadis NV’s (AMS:ARCAD) past track record of performance is a valuable exercise for investors. It enables us to reflect on whether the company has met or exceed expectations, which is a great indicator for future performance. Today I will assess ARCAD’s recent performance announced on 30 June 2018 and evaluate these figures to its longer term trend and industry movements.
Check out our latest analysis for Arcadis
Commentary On ARCAD’s Past Performance
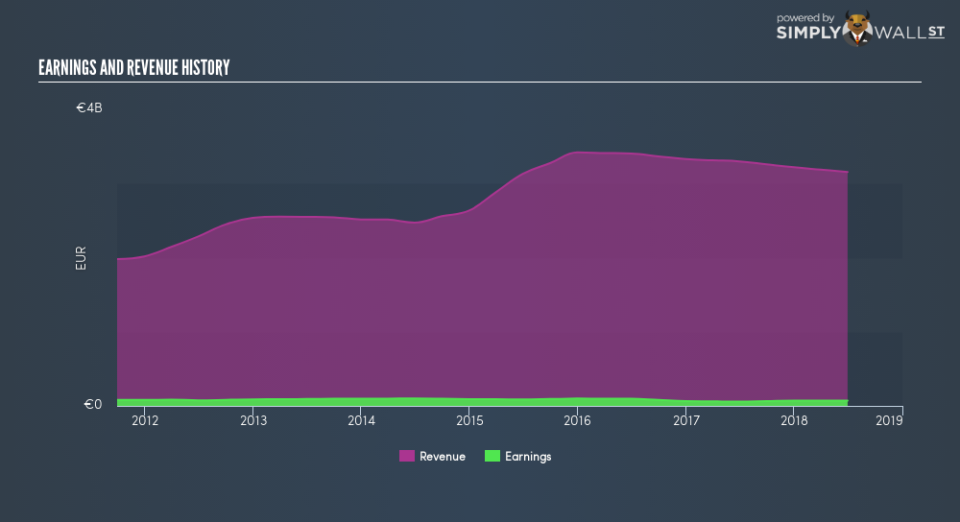
ARCAD’s trailing twelve-month earnings (from 30 June 2018) of €72.25m has jumped 24.48% compared to the previous year. Furthermore, this one-year growth rate has exceeded its 5-year annual growth average of -3.19%, indicating the rate at which ARCAD is growing has accelerated. How has it been able to do this? Let’s see whether it is solely because of an industry uplift, or if Arcadis has experienced some company-specific growth.
In the past few years, Arcadis top-line expansion has overtaken earnings and the growth rate of expenses. Though this has led to a margin contraction, it has moderated Arcadis’s earnings contraction. Viewing growth from a sector-level, the NL construction industry has been growing its average earnings by double-digit 24.48% over the past year, and 11.74% over the past half a decade. This growth is a median of profitable companies of 4 Construction companies in NL including Koninklijke BAM Groep, Batenburg Techniek and Koninklijke VolkerWessels.
In terms of returns from investment, Arcadis has fallen short of achieving a 20% return on equity (ROE), recording 7.21% instead. Furthermore, its return on assets (ROA) of 3.22% is below the NL Construction industry of 3.25%, indicating Arcadis’s are utilized less efficiently. And finally, its return on capital (ROC), which also accounts for Arcadis’s debt level, has declined over the past 3 years from 6.82% to 6.58%.
What does this mean?
While past data is useful, it doesn’t tell the whole story. Recent positive growth isn’t always indicative of a continued optimistic outlook. There could be factors that are influencing the industry as a whole, thus the high industry growth rate over the same time period. I suggest you continue to research Arcadis to get a better picture of the stock by looking at:
Future Outlook: What are well-informed industry analysts predicting for ARCAD’s future growth? Take a look at our free research report of analyst consensus for ARCAD’s outlook.
Financial Health: Are ARCAD’s operations financially sustainable? Balance sheets can be hard to analyze, which is why we’ve done it for you. Check out our financial health checks here.
Other High-Performing Stocks: Are there other stocks that provide better prospects with proven track records? Explore our free list of these great stocks here.
NB: Figures in this article are calculated using data from the trailing twelve months from 30 June 2018. This may not be consistent with full year annual report figures.
To help readers see past the short term volatility of the financial market, we aim to bring you a long-term focused research analysis purely driven by fundamental data. Note that our analysis does not factor in the latest price-sensitive company announcements.
The author is an independent contributor and at the time of publication had no position in the stocks mentioned. For errors that warrant correction please contact the editor at editorial-team@simplywallst.com.
