Does Big Lots, Inc.'s (NYSE:BIG) P/E Ratio Signal A Buying Opportunity?

Want to participate in a short research study? Help shape the future of investing tools and you could win a $250 gift card!
Today, we'll introduce the concept of the P/E ratio for those who are learning about investing. We'll show how you can use Big Lots, Inc.'s (NYSE:BIG) P/E ratio to inform your assessment of the investment opportunity. Looking at earnings over the last twelve months, Big Lots has a P/E ratio of 7.76. That corresponds to an earnings yield of approximately 13%.
Check out our latest analysis for Big Lots
How Do You Calculate A P/E Ratio?
The formula for P/E is:
Price to Earnings Ratio = Share Price ÷ Earnings per Share (EPS)
Or for Big Lots:
P/E of 7.76 = $27.21 ÷ $3.51 (Based on the year to May 2019.)
Is A High Price-to-Earnings Ratio Good?
The higher the P/E ratio, the higher the price tag of a business, relative to its trailing earnings. That isn't necessarily good or bad, but a high P/E implies relatively high expectations of what a company can achieve in the future.
How Growth Rates Impact P/E Ratios
Generally speaking the rate of earnings growth has a profound impact on a company's P/E multiple. Earnings growth means that in the future the 'E' will be higher. That means unless the share price increases, the P/E will reduce in a few years. A lower P/E should indicate the stock is cheap relative to others -- and that may attract buyers.
Big Lots saw earnings per share decrease by 13% last year. But over the longer term (5 years) earnings per share have increased by 8.7%.
How Does Big Lots's P/E Ratio Compare To Its Peers?
The P/E ratio essentially measures market expectations of a company. If you look at the image below, you can see Big Lots has a lower P/E than the average (9.8) in the multiline retail industry classification.
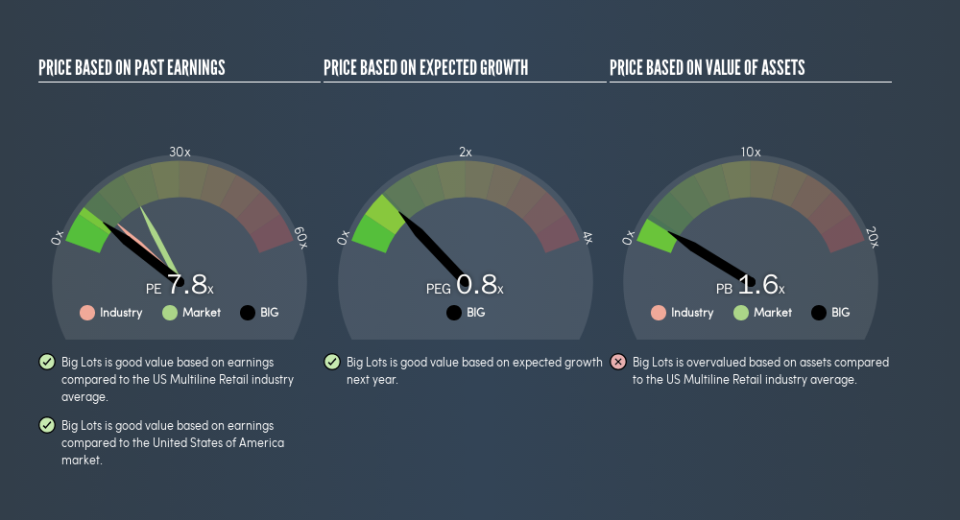
This suggests that market participants think Big Lots will underperform other companies in its industry. While current expectations are low, the stock could be undervalued if the situation is better than the market assumes. It is arguably worth checking if insiders are buying shares, because that might imply they believe the stock is undervalued.
Remember: P/E Ratios Don't Consider The Balance Sheet
The 'Price' in P/E reflects the market capitalization of the company. In other words, it does not consider any debt or cash that the company may have on the balance sheet. The exact same company would hypothetically deserve a higher P/E ratio if it had a strong balance sheet, than if it had a weak one with lots of debt, because a cashed up company can spend on growth.
Spending on growth might be good or bad a few years later, but the point is that the P/E ratio does not account for the option (or lack thereof).
So What Does Big Lots's Balance Sheet Tell Us?
Big Lots's net debt equates to 38% of its market capitalization. You'd want to be aware of this fact, but it doesn't bother us.
The Verdict On Big Lots's P/E Ratio
Big Lots trades on a P/E ratio of 7.8, which is below the US market average of 18.2. Since it only carries a modest debt load, it's likely the low expectations implied by the P/E ratio arise from the lack of recent earnings growth.
When the market is wrong about a stock, it gives savvy investors an opportunity. As value investor Benjamin Graham famously said, 'In the short run, the market is a voting machine but in the long run, it is a weighing machine.' So this free report on the analyst consensus forecasts could help you make a master move on this stock.
You might be able to find a better buy than Big Lots. If you want a selection of possible winners, check out this free list of interesting companies that trade on a P/E below 20 (but have proven they can grow earnings).
We aim to bring you long-term focused research analysis driven by fundamental data. Note that our analysis may not factor in the latest price-sensitive company announcements or qualitative material.
If you spot an error that warrants correction, please contact the editor at editorial-team@simplywallst.com. This article by Simply Wall St is general in nature. It does not constitute a recommendation to buy or sell any stock, and does not take account of your objectives, or your financial situation. Simply Wall St has no position in the stocks mentioned. Thank you for reading.
