How Does Citigold Corporation Limited’s (ASX:CTO) EPS Growth Stack Up Against Industry Performance?

For long-term investors, assessing earnings trend over time and against industry benchmarks is more beneficial than examining a single earnings announcement at a point in time. Investors may find my commentary, albeit very high-level and brief, on Citigold Corporation Limited (ASX:CTO) useful as an attempt to give more color around how Citigold is currently performing. See our latest analysis for Citigold
Did CTO’s recent EPS Growth beat the long-term trend and the industry?
For the purpose of this commentary, I like to use the ‘latest twelve-month’ data, which annualizes the latest 6-month earnings release, or some times, the latest annual report is already the most recent financial data. This technique enables me to examine different stocks in a uniform manner using the most relevant data points. Citigold’s most recent bottom-line -A$6.6M, which, against the prior year’s figure, has become less negative. Since these values are relatively short-term, I have created an annualized five-year figure for CTO’s earnings, which stands at -A$20.2M. This suggests that, though net income is negative, it has become less negative over the years.
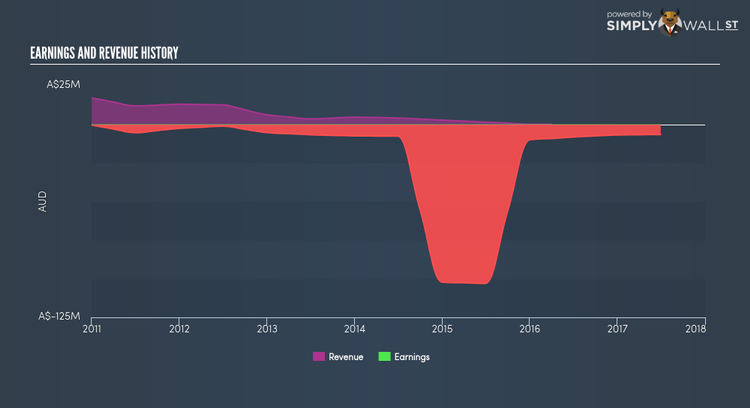
Additionally, we can assess Citigold’s loss by researching what’s going on in the industry as well as within the company. First, I want to briefly look into the line items. Revenue growth over the last couple of years has been negative at -47.01%. The key to profitability here is to make sure the company’s cost growth is well-controlled. Inspecting growth from a sector-level, the Australian metals and mining industry has been growing, albeit, at a unexciting single-digit rate of 7.36% over the previous year, and 8.50% over the past couple of years. This shows that, while Citigold is presently loss-making, it may have gained from industry tailwinds, moving earnings into a more favorable position.
What does this mean?
Though Citigold’s past data is helpful, it is only one aspect of my investment thesis. With companies that are currently loss-making, it is always difficult to envisage what will occur going forward, and when. The most insightful step is to assess company-specific issues Citigold may be facing and whether management guidance has dependably been met in the past. You should continue to research Citigold to get a more holistic view of the stock by looking at:
1. Financial Health: Is CTO’s operations financially sustainable? Balance sheets can be hard to analyze, which is why we’ve done it for you. Check out our financial health checks here.
2. Other High-Performing Stocks: Are there other stocks that provide better prospects with proven track records? Explore our free list of these great stocks here.
NB: Figures in this article are calculated using data from the last twelve months, which refer to the 12-month period ending on the last date of the month the financial statement is dated. This may not be consistent with full year annual report figures.
To help readers see pass the short term volatility of the financial market, we aim to bring you a long-term focused research analysis purely driven by fundamental data. Note that our analysis does not factor in the latest price sensitive company announcements.
The author is an independent contributor and at the time of publication had no position in the stocks mentioned.
