What does Dover Corporation’s (NYSE:DOV) Balance Sheet Tell Us Abouts Its Future?

Dover Corporation (NYSE:DOV), a large-cap worth $16.27B, comes to mind for investors seeking a strong and reliable stock investment. Doing business globally, large caps tend to have diversified revenue streams and attractive capital returns, making them desirable investments for risk-averse portfolios. However, the key to their continued success lies in its financial health. Today we will look at Dover’s financial liquidity and debt levels, which are strong indicators for whether the company can weather economic downturns or fund strategic acquisitions for future growth. Note that this information is centred entirely on financial health and is a high-level overview, so I encourage you to look further into DOV here. View our latest analysis for Dover
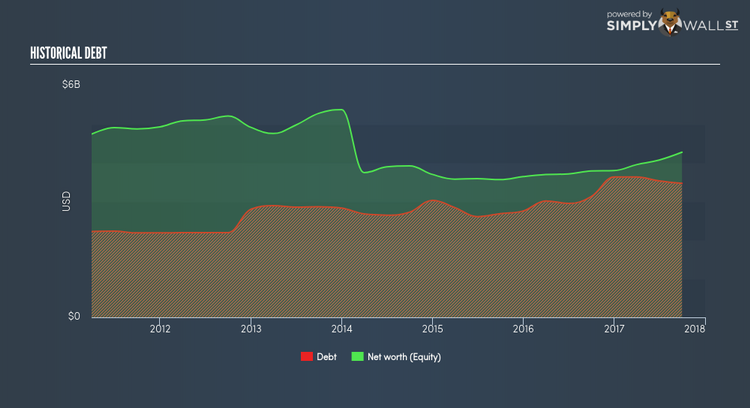
How does DOV’s operating cash flow stack up against its debt?
DOV has built up its total debt levels in the last twelve months, from $2,754.8M to $3,634.8M , which is made up of current and long term debt. With this rise in debt, DOV currently has $349.1M remaining in cash and short-term investments , ready to deploy into the business. Moreover, DOV has produced cash from operations of $862.0M during the same period of time, leading to an operating cash to total debt ratio of 23.71%, meaning that DOV’s operating cash is sufficient to cover its debt. This ratio can also be a sign of operational efficiency as an alternative to return on assets. In DOV’s case, it is able to generate 0.24x cash from its debt capital.
Can DOV meet its short-term obligations with the cash in hand?
With current liabilities at $1,940.3M, the company has been able to meet these commitments with a current assets level of $2,589.2M, leading to a 1.33x current account ratio. For Machinery companies, this ratio is within a sensible range since there is a bit of a cash buffer without leaving too much capital in a low-return environment.
Can DOV service its debt comfortably?
DOV is a relatively highly levered company with a debt-to-equity of 81.14%. This is common amongst large-cap companies because debt can often be a less expensive alternative to equity due to tax deductibility of interest payments. Since large-caps are seen as safer than their smaller constituents, they tend to enjoy lower cost of capital. We can test if DOV’s debt levels are sustainable by measuring interest payments against earnings of a company. Ideally, earnings before interest and tax (EBIT) should cover net interest by at least three times. In DOV’s case, the ratio of 6.71x suggests that interest is well-covered. Strong interest coverage is seen as a responsible and safe practice, which highlights why most investors believe large-caps such as DOV is a safe investment.
Next Steps:
DOV’s cash flow coverage indicates it could improve its operating efficiency in order to meet demand for debt repayments should unforeseen events arise. Though, the company exhibits an ability to meet its near-term obligations, which isn’t a big surprise for a large-cap. This is only a rough assessment of financial health, and I’m sure DOV has company-specific issues impacting its capital structure decisions. I suggest you continue to research Dover to get a better picture of the stock by looking at:
1. Future Outlook: What are well-informed industry analysts predicting for DOV’s future growth? Take a look at our free research report of analyst consensus for DOV’s outlook.
2. Valuation: What is DOV worth today? Is the stock undervalued, even when its growth outlook is factored into its intrinsic value? The intrinsic value infographic in our free research report helps visualize whether DOV is currently mispriced by the market.
3. Other High-Performing Stocks: Are there other stocks that provide better prospects with proven track records? Explore our free list of these great stocks here.
To help readers see pass the short term volatility of the financial market, we aim to bring you a long-term focused research analysis purely driven by fundamental data. Note that our analysis does not factor in the latest price sensitive company announcements.
The author is an independent contributor and at the time of publication had no position in the stocks mentioned.
