How Does Group's (ASX:PTB) P/E Compare To Its Industry, After Its Big Share Price Gain?

Those holding Group (ASX:PTB) shares must be pleased that the share price has rebounded 36% in the last thirty days. But unfortunately, the stock is still down by 42% over a quarter. But shareholders may not all be feeling jubilant, since the share price is still down 40% in the last year.
All else being equal, a sharp share price increase should make a stock less attractive to potential investors. While the market sentiment towards a stock is very changeable, in the long run, the share price will tend to move in the same direction as earnings per share. So some would prefer to hold off buying when there is a lot of optimism towards a stock. Perhaps the simplest way to get a read on investors' expectations of a business is to look at its Price to Earnings Ratio (PE Ratio). Investors have optimistic expectations of companies with higher P/E ratios, compared to companies with lower P/E ratios.
View our latest analysis for Group
Does Group Have A Relatively High Or Low P/E For Its Industry?
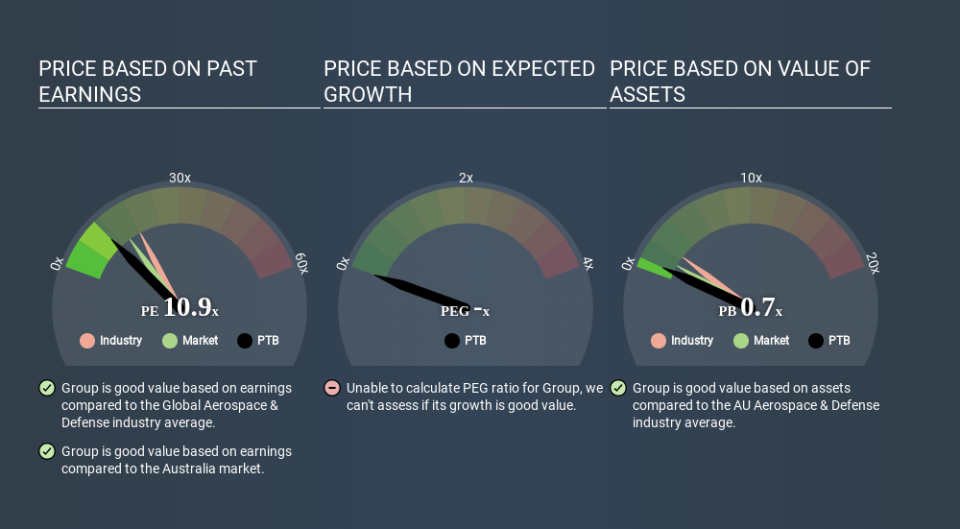
Group's P/E of 10.86 indicates relatively low sentiment towards the stock. The image below shows that Group has a lower P/E than the average (18.2) P/E for companies in the aerospace & defense industry.
This suggests that market participants think Group will underperform other companies in its industry. Many investors like to buy stocks when the market is pessimistic about their prospects. If you consider the stock interesting, further research is recommended. For example, I often monitor director buying and selling.
How Growth Rates Impact P/E Ratios
Companies that shrink earnings per share quickly will rapidly decrease the 'E' in the equation. That means even if the current P/E is low, it will increase over time if the share price stays flat. So while a stock may look cheap based on past earnings, it could be expensive based on future earnings.
Group saw earnings per share decrease by 31% last year. And EPS is down 8.4% a year, over the last 5 years. This growth rate might warrant a below average P/E ratio.
Don't Forget: The P/E Does Not Account For Debt or Bank Deposits
Don't forget that the P/E ratio considers market capitalization. So it won't reflect the advantage of cash, or disadvantage of debt. Theoretically, a business can improve its earnings (and produce a lower P/E in the future) by investing in growth. That means taking on debt (or spending its cash).
Spending on growth might be good or bad a few years later, but the point is that the P/E ratio does not account for the option (or lack thereof).
So What Does Group's Balance Sheet Tell Us?
Net debt totals 11% of Group's market cap. This could bring some additional risk, and reduce the number of investment options for management; worth remembering if you compare its P/E to businesses without debt.
The Verdict On Group's P/E Ratio
Group trades on a P/E ratio of 10.9, which is below the AU market average of 14.7. With only modest debt, it's likely the lack of EPS growth at least partially explains the pessimism implied by the P/E ratio. What is very clear is that the market has become more optimistic about Group over the last month, with the P/E ratio rising from 8.0 back then to 10.9 today. If you like to buy stocks that have recently impressed the market, then this one might be a candidate; but if you prefer to invest when there is 'blood in the streets', then you may feel the opportunity has passed.
Investors have an opportunity when market expectations about a stock are wrong. As value investor Benjamin Graham famously said, 'In the short run, the market is a voting machine but in the long run, it is a weighing machine. We don't have analyst forecasts, but you might want to assess this data-rich visualization of earnings, revenue and cash flow.
But note: Group may not be the best stock to buy. So take a peek at this free list of interesting companies with strong recent earnings growth (and a P/E ratio below 20).
If you spot an error that warrants correction, please contact the editor at editorial-team@simplywallst.com. This article by Simply Wall St is general in nature. It does not constitute a recommendation to buy or sell any stock, and does not take account of your objectives, or your financial situation. Simply Wall St has no position in the stocks mentioned.
We aim to bring you long-term focused research analysis driven by fundamental data. Note that our analysis may not factor in the latest price-sensitive company announcements or qualitative material. Thank you for reading.
