Does Khadim India Limited (NSE:KHADIM) Create Value For Shareholders?

Want to participate in a short research study? Help shape the future of investing tools and you could win a $250 gift card!
While some investors are already well versed in financial metrics (hat tip), this article is for those who would like to learn about Return On Equity (ROE) and why it is important. We'll use ROE to examine Khadim India Limited (NSE:KHADIM), by way of a worked example.
Khadim India has a ROE of 7.4%, based on the last twelve months. One way to conceptualize this, is that for each ₹1 of shareholders' equity it has, the company made ₹0.074 in profit.
See our latest analysis for Khadim India
How Do You Calculate ROE?
The formula for ROE is:
Return on Equity = Net Profit ÷ Shareholders' Equity
Or for Khadim India:
7.4% = ₹212m ÷ ₹2.9b (Based on the trailing twelve months to March 2019.)
Most know that net profit is the total earnings after all expenses, but the concept of shareholders' equity is a little more complicated. It is all earnings retained by the company, plus any capital paid in by shareholders. You can calculate shareholders' equity by subtracting the company's total liabilities from its total assets.
What Does ROE Signify?
ROE measures a company's profitability against the profit it retains, and any outside investments. The 'return' is the yearly profit. The higher the ROE, the more profit the company is making. So, as a general rule, a high ROE is a good thing. That means ROE can be used to compare two businesses.
Does Khadim India Have A Good Return On Equity?
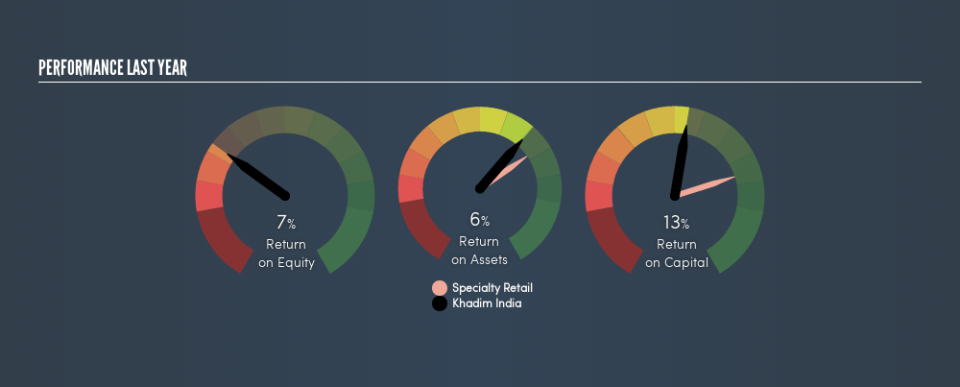
One simple way to determine if a company has a good return on equity is to compare it to the average for its industry. However, this method is only useful as a rough check, because companies do differ quite a bit within the same industry classification. The image below shows that Khadim India has an ROE that is roughly in line with the Specialty Retail industry average (7.1%).
That isn't amazing, but it is respectable. ROE can give us a view about company quality, but many investors also look to other factors, such as whether there are insiders buying shares. I will like Khadim India better if I see some big insider buys. While we wait, check out this free list of growing companies with considerable, recent, insider buying.
The Importance Of Debt To Return On Equity
Companies usually need to invest money to grow their profits. That cash can come from retained earnings, issuing new shares (equity), or debt. In the first two cases, the ROE will capture this use of capital to grow. In the latter case, the use of debt will improve the returns, but will not change the equity. That will make the ROE look better than if no debt was used.
Khadim India's Debt And Its 7.4% ROE
While Khadim India does have some debt, with debt to equity of just 0.38, we wouldn't say debt is excessive. Its ROE is quite low, and the company already has some debt, so surely shareholders are hoping for an improvement. Judicious use of debt to improve returns can certainly be a good thing, although it does elevate risk slightly and reduce future optionality.
But It's Just One Metric
Return on equity is a useful indicator of the ability of a business to generate profits and return them to shareholders. A company that can achieve a high return on equity without debt could be considered a high quality business. All else being equal, a higher ROE is better.
But when a business is high quality, the market often bids it up to a price that reflects this. It is important to consider other factors, such as future profit growth -- and how much investment is required going forward. So you might want to check this FREE visualization of analyst forecasts for the company.
But note: Khadim India may not be the best stock to buy. So take a peek at this free list of interesting companies with high ROE and low debt.
We aim to bring you long-term focused research analysis driven by fundamental data. Note that our analysis may not factor in the latest price-sensitive company announcements or qualitative material.
If you spot an error that warrants correction, please contact the editor at editorial-team@simplywallst.com. This article by Simply Wall St is general in nature. It does not constitute a recommendation to buy or sell any stock, and does not take account of your objectives, or your financial situation. Simply Wall St has no position in the stocks mentioned. Thank you for reading.
