Does The Market Have A Low Tolerance For Complii FinTech Solutions Ltd's (ASX:CF1) Mixed Fundamentals?
Complii FinTech Solutions (ASX:CF1) has had a rough three months with its share price down 7.8%. It is possible that the markets have ignored the company's differing financials and decided to lean-in to the negative sentiment. Fundamentals usually dictate market outcomes so it makes sense to study the company's financials. Particularly, we will be paying attention to Complii FinTech Solutions' ROE today.
Return on equity or ROE is a key measure used to assess how efficiently a company's management is utilizing the company's capital. In short, ROE shows the profit each dollar generates with respect to its shareholder investments.
View our latest analysis for Complii FinTech Solutions
How To Calculate Return On Equity?
The formula for return on equity is:
Return on Equity = Net Profit (from continuing operations) ÷ Shareholders' Equity
So, based on the above formula, the ROE for Complii FinTech Solutions is:
1.0% = AU$115k ÷ AU$11m (Based on the trailing twelve months to June 2022).
The 'return' is the income the business earned over the last year. Another way to think of that is that for every A$1 worth of equity, the company was able to earn A$0.01 in profit.
Why Is ROE Important For Earnings Growth?
We have already established that ROE serves as an efficient profit-generating gauge for a company's future earnings. Depending on how much of these profits the company reinvests or "retains", and how effectively it does so, we are then able to assess a company’s earnings growth potential. Assuming everything else remains unchanged, the higher the ROE and profit retention, the higher the growth rate of a company compared to companies that don't necessarily bear these characteristics.
Complii FinTech Solutions' Earnings Growth And 1.0% ROE
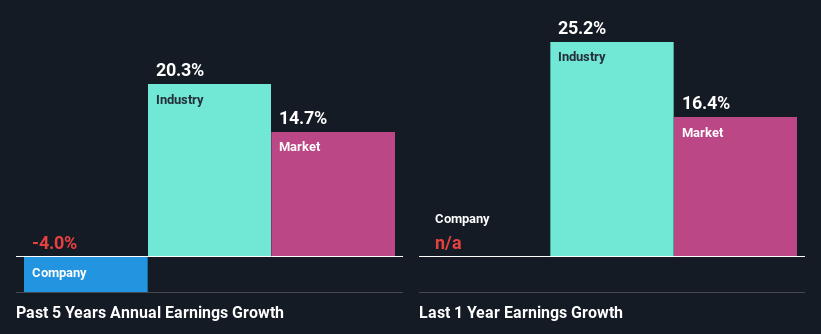
As you can see, Complii FinTech Solutions' ROE looks pretty weak. Not just that, even compared to the industry average of 12%, the company's ROE is entirely unremarkable. Therefore, it might not be wrong to say that the five year net income decline of 4.0% seen by Complii FinTech Solutions was possibly a result of it having a lower ROE. We believe that there also might be other aspects that are negatively influencing the company's earnings prospects. For instance, the company has a very high payout ratio, or is faced with competitive pressures.
So, as a next step, we compared Complii FinTech Solutions' performance against the industry and were disappointed to discover that while the company has been shrinking its earnings, the industry has been growing its earnings at a rate of 20% in the same period.
Earnings growth is a huge factor in stock valuation. The investor should try to establish if the expected growth or decline in earnings, whichever the case may be, is priced in. Doing so will help them establish if the stock's future looks promising or ominous. If you're wondering about Complii FinTech Solutions''s valuation, check out this gauge of its price-to-earnings ratio, as compared to its industry.
Is Complii FinTech Solutions Efficiently Re-investing Its Profits?
Complii FinTech Solutions doesn't pay any dividend, meaning that potentially all of its profits are being reinvested in the business, which doesn't explain why the company's earnings have shrunk if it is retaining all of its profits. So there might be other factors at play here which could potentially be hampering growth. For example, the business has faced some headwinds.
Conclusion
Overall, we have mixed feelings about Complii FinTech Solutions. Even though it appears to be retaining most of its profits, given the low ROE, investors may not be benefitting from all that reinvestment after all. The low earnings growth suggests our theory correct. Wrapping up, we would proceed with caution with this company and one way of doing that would be to look at the risk profile of the business. To know the 2 risks we have identified for Complii FinTech Solutions visit our risks dashboard for free.
Have feedback on this article? Concerned about the content? Get in touch with us directly. Alternatively, email editorial-team (at) simplywallst.com.
This article by Simply Wall St is general in nature. We provide commentary based on historical data and analyst forecasts only using an unbiased methodology and our articles are not intended to be financial advice. It does not constitute a recommendation to buy or sell any stock, and does not take account of your objectives, or your financial situation. We aim to bring you long-term focused analysis driven by fundamental data. Note that our analysis may not factor in the latest price-sensitive company announcements or qualitative material. Simply Wall St has no position in any stocks mentioned.
Join A Paid User Research Session
You’ll receive a US$30 Amazon Gift card for 1 hour of your time while helping us build better investing tools for the individual investors like yourself. Sign up here
