What Does Motor Oil (Hellas) Corinth Refineries S.A.'s (ATH:MOH) P/E Ratio Tell You?

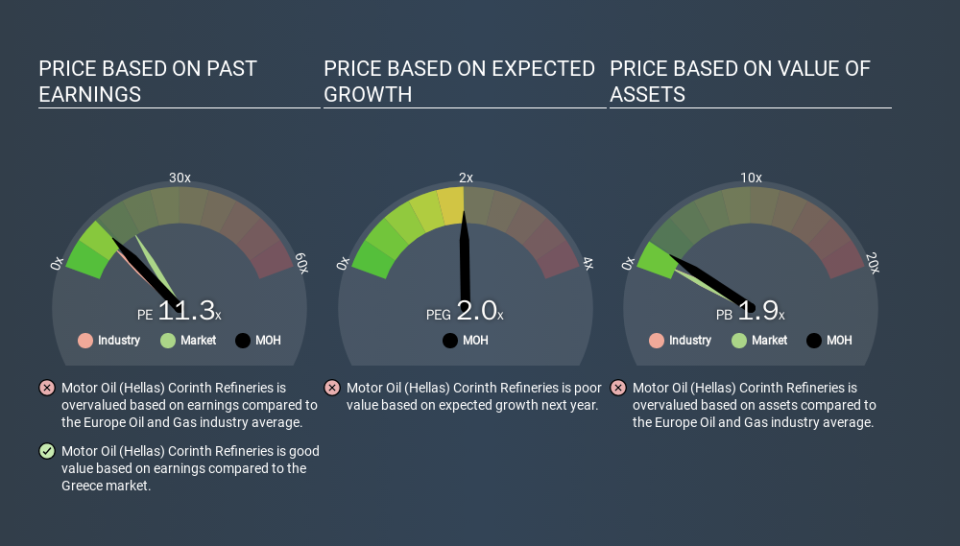
This article is for investors who would like to improve their understanding of price to earnings ratios (P/E ratios). To keep it practical, we'll show how Motor Oil (Hellas) Corinth Refineries S.A.'s (ATH:MOH) P/E ratio could help you assess the value on offer. Based on the last twelve months, Motor Oil (Hellas) Corinth Refineries's P/E ratio is 11.25. That means that at current prices, buyers pay €11.25 for every €1 in trailing yearly profits.
View our latest analysis for Motor Oil (Hellas) Corinth Refineries
How Do I Calculate A Price To Earnings Ratio?
The formula for P/E is:
Price to Earnings Ratio = Share Price ÷ Earnings per Share (EPS)
Or for Motor Oil (Hellas) Corinth Refineries:
P/E of 11.25 = EUR20.76 ÷ EUR1.85 (Based on the trailing twelve months to September 2019.)
Is A High Price-to-Earnings Ratio Good?
A higher P/E ratio means that investors are paying a higher price for each EUR1 of company earnings. That isn't necessarily good or bad, but a high P/E implies relatively high expectations of what a company can achieve in the future.
Does Motor Oil (Hellas) Corinth Refineries Have A Relatively High Or Low P/E For Its Industry?
The P/E ratio indicates whether the market has higher or lower expectations of a company. As you can see below, Motor Oil (Hellas) Corinth Refineries has a higher P/E than the average company (9.6) in the oil and gas industry.
Its relatively high P/E ratio indicates that Motor Oil (Hellas) Corinth Refineries shareholders think it will perform better than other companies in its industry classification. Clearly the market expects growth, but it isn't guaranteed. So investors should delve deeper. I like to check if company insiders have been buying or selling.
How Growth Rates Impact P/E Ratios
When earnings fall, the 'E' decreases, over time. Therefore, even if you pay a low multiple of earnings now, that multiple will become higher in the future. A higher P/E should indicate the stock is expensive relative to others -- and that may encourage shareholders to sell.
Motor Oil (Hellas) Corinth Refineries's earnings per share fell by 41% in the last twelve months. And EPS is down 2.9% a year, over the last 3 years. This might lead to low expectations.
A Limitation: P/E Ratios Ignore Debt and Cash In The Bank
The 'Price' in P/E reflects the market capitalization of the company. So it won't reflect the advantage of cash, or disadvantage of debt. Hypothetically, a company could reduce its future P/E ratio by spending its cash (or taking on debt) to achieve higher earnings.
Spending on growth might be good or bad a few years later, but the point is that the P/E ratio does not account for the option (or lack thereof).
Is Debt Impacting Motor Oil (Hellas) Corinth Refineries's P/E?
Motor Oil (Hellas) Corinth Refineries has net debt worth 13% of its market capitalization. That's enough debt to impact the P/E ratio a little; so keep it in mind if you're comparing it to companies without debt.
The Bottom Line On Motor Oil (Hellas) Corinth Refineries's P/E Ratio
Motor Oil (Hellas) Corinth Refineries's P/E is 11.3 which is below average (17.0) in the GR market. Since it only carries a modest debt load, it's likely the low expectations implied by the P/E ratio arise from the lack of recent earnings growth.
Investors should be looking to buy stocks that the market is wrong about. If it is underestimating a company, investors can make money by buying and holding the shares until the market corrects itself. So this free visualization of the analyst consensus on future earnings could help you make the right decision about whether to buy, sell, or hold.
But note: Motor Oil (Hellas) Corinth Refineries may not be the best stock to buy. So take a peek at this free list of interesting companies with strong recent earnings growth (and a P/E ratio below 20).
If you spot an error that warrants correction, please contact the editor at editorial-team@simplywallst.com. This article by Simply Wall St is general in nature. It does not constitute a recommendation to buy or sell any stock, and does not take account of your objectives, or your financial situation. Simply Wall St has no position in the stocks mentioned.
We aim to bring you long-term focused research analysis driven by fundamental data. Note that our analysis may not factor in the latest price-sensitive company announcements or qualitative material. Thank you for reading.
