How Does Neonode Inc (NEON) Affect Your Portfolio Returns?

If you are a shareholder in Neonode Inc’s (NASDAQ:NEON), or are thinking about investing in the company, knowing how it contributes to the risk and reward profile of your portfolio is important. The beta measures NEON’s exposure to the wider market risk, which reflects changes in economic and political factors. Not every stock is exposed to the same level of market risk, and the broad market index represents a beta value of one. A stock with a beta greater than one is considered more sensitive to market-wide shocks compared to a stock that trades below the value of one.
Check out our latest analysis for Neonode
An interpretation of NEON's beta
With a beta of 1.24, Neonode is a stock that tends to experience more gains than the market during a growth phase and also a bigger reduction in value compared to the market during a broad downturn. According to this value of beta, NEON will help diversify your portfolio, if it currently comprises of low-beta stocks. This will be beneficial for portfolio returns, in particular, when current market sentiment is positive.
Does NEON's size and industry impact the expected beta?
With a market cap of USD $75.00M, NEON falls within the small-cap spectrum of stocks, which are found to experience higher relative risk compared to larger companies. In addition to size, NEON also operates in the electronic equipment, instruments and components industry, which has commonly demonstrated strong reactions to market-wide shocks. As a result, we should expect higher beta for small-cap stocks in a cyclical industry compared to larger stocks in a defensive industry. This is consistent with NEON’s individual beta value we discussed above. Next, we will examine the fundamental factors which can cause cyclicality in the stock.
Is NEON's cost structure indicative of a high beta?
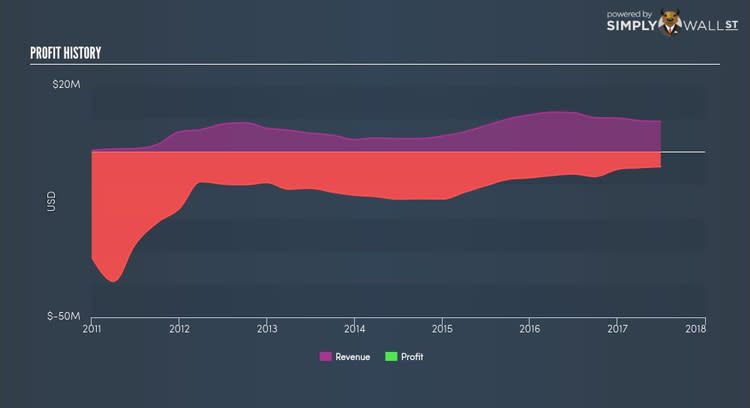
During times of economic downturn, low demand may cause companies to readjust production of their goods and services. It is more difficult for companies to lower their cost, if the majority of these costs are generated by fixed assets. Therefore, this is a type of risk which is associated with higher beta. I test NEON’s ratio of fixed assets to total assets in order to determine how high the risk is associated with this type of constraint. NEON's fixed assets to total assets ratio of higher than 30% shows that the company uses up a big chunk of its capital on assets that are hard to scale up or down in short notice. As a result, this aspect of NEON indicates a higher beta than a similar size company with a lower portion of fixed assets on their balance sheet. This is consistent with is current beta value which also indicates high volatility.
What this means for you:
Are you a shareholder? You may reap the gains of NEON's returns in times of an economic boom. Though the business does have higher fixed cost than what is considered safe, during times of growth, consumer demand may be high enough to not warrant immediate concerns. However, during a downturn, a more defensive stock can cushion the impact of this risk.
Are you a potential investor? I recommend that you look into NEON's fundamental factors such as its current valuation and financial health as well. Take into account your portfolio sensitivity to the market before you invest in the stock, as well as where we are in the current economic cycle. NEON may be a great investment during times of economic growth.
Beta is one aspect of your portfolio construction to consider when holding or entering into a stock. But it is certainly not the only factor. Take a look at our most recent infographic report on Neonode for a more in-depth analysis of the stock to help you make a well-informed investment decision. But if you are not interested in Neonode anymore, you can use our free platform to see my list of over 50 other stocks with a high growth potential.
To help readers see pass the short term volatility of the financial market, we aim to bring you a long-term focused research analysis purely driven by fundamental data. Note that our analysis does not factor in the latest price sensitive company announcements.
The author is an independent contributor and at the time of publication had no position in the stocks mentioned.

