What does Smart Sand Inc’s (NASDAQ:SND) Balance Sheet Tell Us About Its Future?

While small-cap stocks, such as Smart Sand Inc (NASDAQ:SND) with its market cap of US$135m, are popular for their explosive growth, investors should also be aware of their balance sheet to judge whether the company can survive a downturn. Energy Services companies, even ones that are profitable, tend to be high risk. Evaluating financial health as part of your investment thesis is crucial. Here are few basic financial health checks you should consider before taking the plunge. Though, given that I have not delve into the company-specifics, I suggest you dig deeper yourself into SND here.
Does SND produce enough cash relative to debt?
SND’s debt levels surged from US$937k to US$44m over the last 12 months , which includes long-term debt. With this rise in debt, SND currently has US$1.2m remaining in cash and short-term investments , ready to deploy into the business. On top of this, SND has produced US$41m in operating cash flow during the same period of time, resulting in an operating cash to total debt ratio of 92%, meaning that SND’s operating cash is sufficient to cover its debt. This ratio can also be interpreted as a measure of efficiency as an alternative to return on assets. In SND’s case, it is able to generate 0.92x cash from its debt capital.
Can SND meet its short-term obligations with the cash in hand?
With current liabilities at US$31m, the company has been able to meet these obligations given the level of current assets of US$54m, with a current ratio of 1.71x. For Energy Services companies, this ratio is within a sensible range since there’s a sufficient cash cushion without leaving too much capital idle or in low-earning investments.
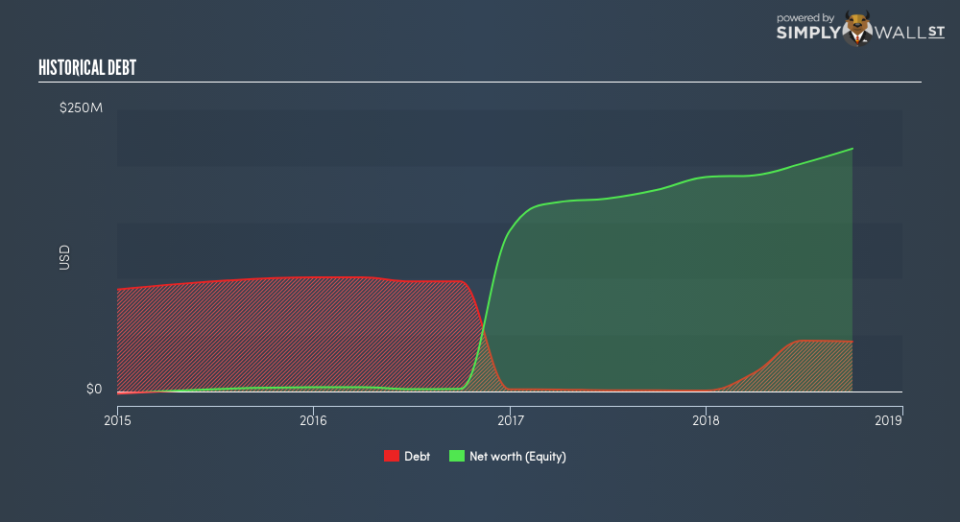
Is SND’s debt level acceptable?
SND’s level of debt is appropriate relative to its total equity, at 21%. SND is not taking on too much debt commitment, which may be constraining for future growth. We can test if SND’s debt levels are sustainable by measuring interest payments against earnings of a company. Ideally, earnings before interest and tax (EBIT) should cover net interest by at least three times. For SND, the ratio of 22.8x suggests that interest is comfortably covered, which means that debtors may be willing to loan the company more money, giving SND ample headroom to grow its debt facilities.
Next Steps:
SND has demonstrated its ability to generate sufficient levels of cash flow, while its debt hovers at an appropriate level. Furthermore, the company exhibits proper management of current assets and upcoming liabilities. Keep in mind I haven’t considered other factors such as how SND has been performing in the past. I recommend you continue to research Smart Sand to get a better picture of the stock by looking at:
Future Outlook: What are well-informed industry analysts predicting for SND’s future growth? Take a look at our free research report of analyst consensus for SND’s outlook.
Valuation: What is SND worth today? Is the stock undervalued, even when its growth outlook is factored into its intrinsic value? The intrinsic value infographic in our free research report helps visualize whether SND is currently mispriced by the market.
Other High-Performing Stocks: Are there other stocks that provide better prospects with proven track records? Explore our free list of these great stocks here.
To help readers see past the short term volatility of the financial market, we aim to bring you a long-term focused research analysis purely driven by fundamental data. Note that our analysis does not factor in the latest price-sensitive company announcements.
The author is an independent contributor and at the time of publication had no position in the stocks mentioned. For errors that warrant correction please contact the editor at editorial-team@simplywallst.com.
