How Dominion Energy Inc (NYSE:D) Delivered A Better ROE Than Its Industry

This article is intended for those of you who are at the beginning of your investing journey and want to learn about Return on Equity using a real-life example.
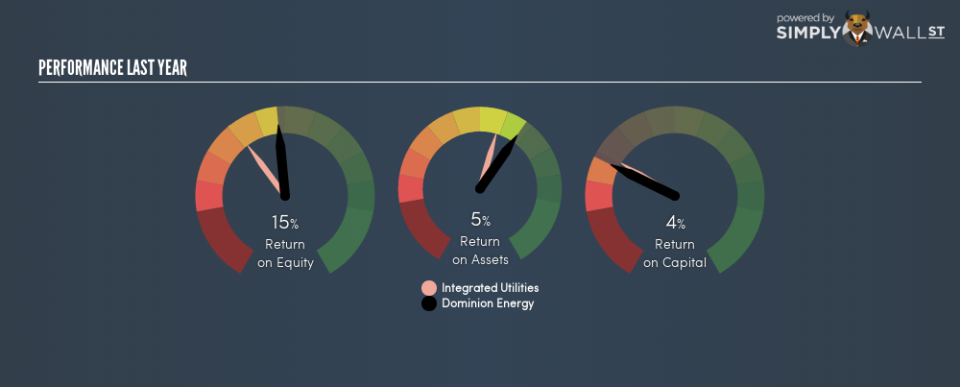
With an ROE of 15.1%, Dominion Energy Inc (NYSE:D) outpaced its own industry which delivered a less exciting 10.1% over the past year. While the impressive ratio tells us that D has made significant profits from little equity capital, ROE doesn’t tell us if D has borrowed debt to make this happen. In this article, we’ll closely examine some factors like financial leverage to evaluate the sustainability of D’s ROE.
See our latest analysis for Dominion Energy
What you must know about ROE
Return on Equity (ROE) is a measure of Dominion Energy’s profit relative to its shareholders’ equity. It essentially shows how much the company can generate in earnings given the amount of equity it has raised. While a higher ROE is preferred in most cases, there are several other factors we should consider before drawing any conclusions.
Return on Equity = Net Profit ÷ Shareholders Equity
Returns are usually compared to costs to measure the efficiency of capital. Dominion Energy’s cost of equity is 8.6%. Since Dominion Energy’s return covers its cost in excess of 6.5%, its use of equity capital is efficient and likely to be sustainable. Simply put, Dominion Energy pays less for its capital than what it generates in return. ROE can be dissected into three distinct ratios: net profit margin, asset turnover, and financial leverage. This is called the Dupont Formula:
Dupont Formula
ROE = profit margin × asset turnover × financial leverage
ROE = (annual net profit ÷ sales) × (sales ÷ assets) × (assets ÷ shareholders’ equity)
ROE = annual net profit ÷ shareholders’ equity
Basically, profit margin measures how much of revenue trickles down into earnings which illustrates how efficient the business is with its cost management. Asset turnover reveals how much revenue can be generated from Dominion Energy’s asset base. And finally, financial leverage is simply how much of assets are funded by equity, which exhibits how sustainable the company’s capital structure is. Since ROE can be artificially increased through excessive borrowing, we should check Dominion Energy’s historic debt-to-equity ratio. At 189%, Dominion Energy’s debt-to-equity ratio appears relatively high and indicates the above-average ROE is generated by significant leverage levels.

Next Steps:
ROE is one of many ratios which meaningfully dissects financial statements, which illustrates the quality of a company. Dominion Energy exhibits a strong ROE against its peers, as well as sufficient returns to cover its cost of equity. Its high debt level means its strong ROE may be driven by debt funding which raises concerns over the sustainability of Dominion Energy’s returns. ROE is a helpful signal, but it is definitely not sufficient on its own to make an investment decision.
For Dominion Energy, I’ve compiled three important aspects you should further examine:
Financial Health: Does it have a healthy balance sheet? Take a look at our free balance sheet analysis with six simple checks on key factors like leverage and risk.
Valuation: What is Dominion Energy worth today? Is the stock undervalued, even when its growth outlook is factored into its intrinsic value? The intrinsic value infographic in our free research report helps visualize whether Dominion Energy is currently mispriced by the market.
Other High-Growth Alternatives : Are there other high-growth stocks you could be holding instead of Dominion Energy? Explore our interactive list of stocks with large growth potential to get an idea of what else is out there you may be missing!
To help readers see past the short term volatility of the financial market, we aim to bring you a long-term focused research analysis purely driven by fundamental data. Note that our analysis does not factor in the latest price-sensitive company announcements.
The author is an independent contributor and at the time of publication had no position in the stocks mentioned. For errors that warrant correction please contact the editor at editorial-team@simplywallst.com.
