Don’t Sell Tempur Sealy International Inc (NYSE:TPX) Before You Read This

This article is for investors who would like to improve their understanding of price to earnings ratios (P/E ratios). To keep it practical, we’ll show how Tempur Sealy International Inc’s (NYSE:TPX) P/E ratio could help you assess the value on offer. Based on the last twelve months, Tempur Sealy International’s P/E ratio is 20.65. That corresponds to an earnings yield of approximately 4.8%.
Check out our latest analysis for Tempur Sealy International
How Do You Calculate A P/E Ratio?
The formula for price to earnings is:
Price to Earnings Ratio = Price per Share ÷ Earnings per Share (EPS)
Or for Tempur Sealy International:
P/E of 20.65 = $51.16 ÷ $2.48 (Based on the trailing twelve months to September 2018.)
Is A High Price-to-Earnings Ratio Good?
A higher P/E ratio means that investors are paying a higher price for each $1 of company earnings. That isn’t a good or a bad thing on its own, but a high P/E means that buyers have a higher opinion of the business’s prospects, relative to stocks with a lower P/E.
How Growth Rates Impact P/E Ratios
P/E ratios primarily reflect market expectations around earnings growth rates. Earnings growth means that in the future the ‘E’ will be higher. Therefore, even if you pay a high multiple of earnings now, that multiple will become lower in the future. A lower P/E should indicate the stock is cheap relative to others — and that may attract buyers.
Tempur Sealy International’s earnings per share fell by 20% in the last twelve months. But it has grown its earnings per share by 17% per year over the last five years.
How Does Tempur Sealy International’s P/E Ratio Compare To Its Peers?
The P/E ratio indicates whether the market has higher or lower expectations of a company. You can see in the image below that the average P/E (11.7) for companies in the consumer durables industry is lower than Tempur Sealy International’s P/E.
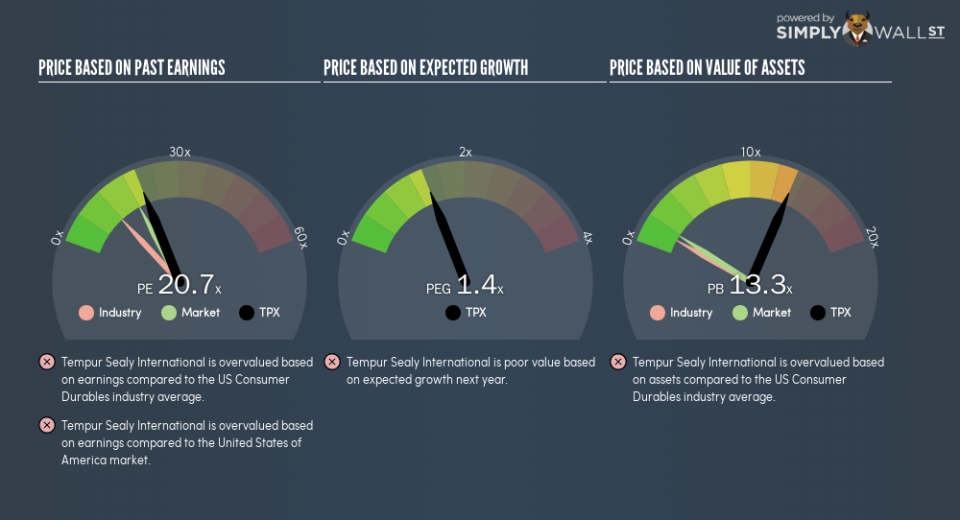
Its relatively high P/E ratio indicates that Tempur Sealy International shareholders think it will perform better than other companies in its industry classification. Clearly the market expects growth, but it isn’t guaranteed. So investors should always consider the P/E ratio alongside other factors, such as whether company directors have been buying shares.
A Limitation: P/E Ratios Ignore Debt and Cash In The Bank
It’s important to note that the P/E ratio considers the market capitalization, not the enterprise value. In other words, it does not consider any debt or cash that the company may have on the balance sheet. In theory, a company can lower its future P/E ratio by using cash or debt to invest in growth.
Spending on growth might be good or bad a few years later, but the point is that the P/E ratio does not account for the option (or lack thereof).
Is Debt Impacting Tempur Sealy International’s P/E?
Net debt totals 57% of Tempur Sealy International’s market cap. If you want to compare its P/E ratio to other companies, you should absolutely keep in mind it has significant borrowings.
The Bottom Line On Tempur Sealy International’s P/E Ratio
Tempur Sealy International has a P/E of 20.7. That’s higher than the average in the US market, which is 18. With meaningful debt and a lack of recent earnings growth, the market has high expectations that the business will earn more in the future.
When the market is wrong about a stock, it gives savvy investors an opportunity. If the reality for a company is better than it expects, you can make money by buying and holding for the long term. So this free visualization of the analyst consensus on future earnings could help you make the right decision about whether to buy, sell, or hold.
Of course you might be able to find a better stock than Tempur Sealy International. So you may wish to see this free collection of other companies that have grown earnings strongly.
To help readers see past the short term volatility of the financial market, we aim to bring you a long-term focused research analysis purely driven by fundamental data. Note that our analysis does not factor in the latest price-sensitive company announcements.
The author is an independent contributor and at the time of publication had no position in the stocks mentioned. For errors that warrant correction please contact the editor at editorial-team@simplywallst.com.
