Is Dynasil Corporation of America’s (NASDAQ:DYSL) PE Ratio A Signal To Sell For Investors?

I am writing today to help inform people who are new to the stock market and want to start learning about core concepts of fundamental analysis on practical examples from today’s market.
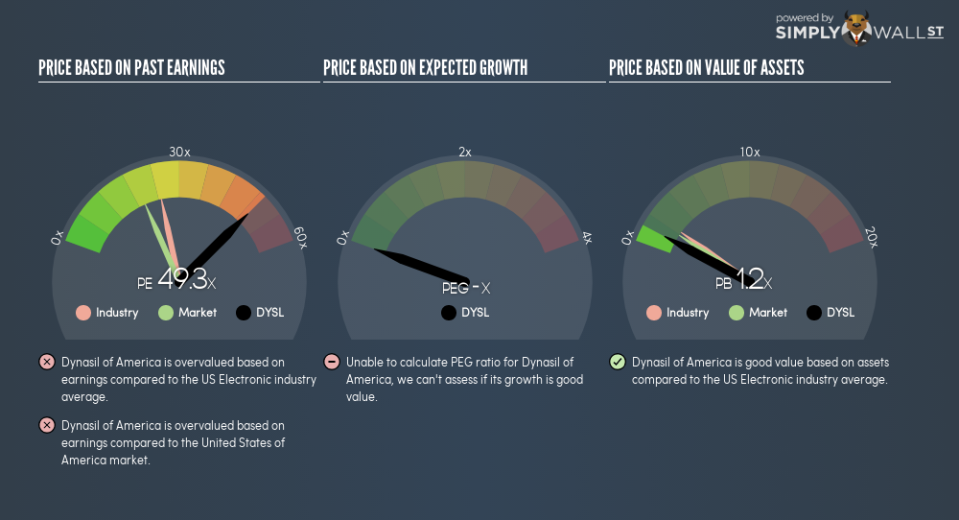
Dynasil Corporation of America (NASDAQ:DYSL) is trading with a trailing P/E of 49.3, which is higher than the industry average of 24.8. Though this might seem to be a negative, you might change your mind after I explain the assumptions behind the P/E ratio. Today, I will deconstruct the P/E ratio and highlight what you need to be careful of when using the P/E ratio.
Check out our latest analysis for Dynasil of America
Breaking down the P/E ratio
P/E is a popular ratio used for relative valuation. By comparing a stock’s price per share to its earnings per share, we are able to see how much investors are paying for each dollar of the company’s earnings.
P/E Calculation for DYSL
Price-Earnings Ratio = Price per share ÷ Earnings per share
DYSL Price-Earnings Ratio = $1.35 ÷ $0.0274 = 49.3x
The P/E ratio itself doesn’t tell you a lot; however, it becomes very insightful when you compare it with other similar companies. We preferably want to compare the stock’s P/E ratio to the average of companies that have similar features to DYSL, such as capital structure and profitability. A common peer group is companies that exist in the same industry, which is what I use. DYSL’s P/E of 49.3 is higher than its industry peers (24.8), which implies that each dollar of DYSL’s earnings is being overvalued by investors. This multiple is a median of profitable companies of 25 Electronic companies in US including Electro Scientific Industries, Hosiden and Surge Components. You could also say that the market is suggesting that DYSL is a stronger business than the average comparable company.
A few caveats
However, you should be aware that this analysis makes certain assumptions. Firstly, that our peer group contains companies that are similar to DYSL. If this isn’t the case, the difference in P/E could be due to other factors. Take, for example, the scenario where Dynasil Corporation of America is growing profits more quickly than the average comparable company. In that case, the market may be correct to value it on a higher P/E ratio. Of course, it is possible that the stocks we are comparing with DYSL are not fairly valued. Just because it is trading on a higher P/E ratio than its peers does not mean it must be overvalued. After all, the peer group could be undervalued.
What this means for you:
If your personal research into the stock confirms what the P/E ratio is telling you, it might be a good time to rebalance your portfolio and reduce your holdings in DYSL. But keep in mind that the usefulness of relative valuation depends on whether you are comfortable with making the assumptions I mentioned above. Remember that basing your investment decision off one metric alone is certainly not sufficient. There are many things I have not taken into account in this article and the PE ratio is very one-dimensional. If you have not done so already, I highly recommend you to complete your research by taking a look at the following:
Future Outlook: What are well-informed industry analysts predicting for DYSL’s future growth? Take a look at our free research report of analyst consensus for DYSL’s outlook.
Past Track Record: Has DYSL been consistently performing well irrespective of the ups and downs in the market? Go into more detail in the past performance analysis and take a look at the free visual representations of DYSL’s historicals for more clarity.
Other High-Performing Stocks: Are there other stocks that provide better prospects with proven track records? Explore our free list of these great stocks here.
To help readers see past the short term volatility of the financial market, we aim to bring you a long-term focused research analysis purely driven by fundamental data. Note that our analysis does not factor in the latest price-sensitive company announcements.
The author is an independent contributor and at the time of publication had no position in the stocks mentioned. For errors that warrant correction please contact the editor at editorial-team@simplywallst.com.
