Is F5 Networks, Inc.’s (NASDAQ:FFIV) 27% ROCE Any Good?

Today we'll evaluate F5 Networks, Inc. (NASDAQ:FFIV) to determine whether it could have potential as an investment idea. In particular, we'll consider its Return On Capital Employed (ROCE), as that can give us insight into how profitably the company is able to employ capital in its business.
First of all, we'll work out how to calculate ROCE. Then we'll compare its ROCE to similar companies. Then we'll determine how its current liabilities are affecting its ROCE.
What is Return On Capital Employed (ROCE)?
ROCE measures the amount of pre-tax profits a company can generate from the capital employed in its business. All else being equal, a better business will have a higher ROCE. Overall, it is a valuable metric that has its flaws. Renowned investment researcher Michael Mauboussin has suggested that a high ROCE can indicate that 'one dollar invested in the company generates value of more than one dollar'.
So, How Do We Calculate ROCE?
Analysts use this formula to calculate return on capital employed:
Return on Capital Employed = Earnings Before Interest and Tax (EBIT) ÷ (Total Assets - Current Liabilities)
Or for F5 Networks:
0.27 = US$577m ÷ (US$3.2b - US$1.1b) (Based on the trailing twelve months to June 2019.)
Therefore, F5 Networks has an ROCE of 27%.
View our latest analysis for F5 Networks
Does F5 Networks Have A Good ROCE?
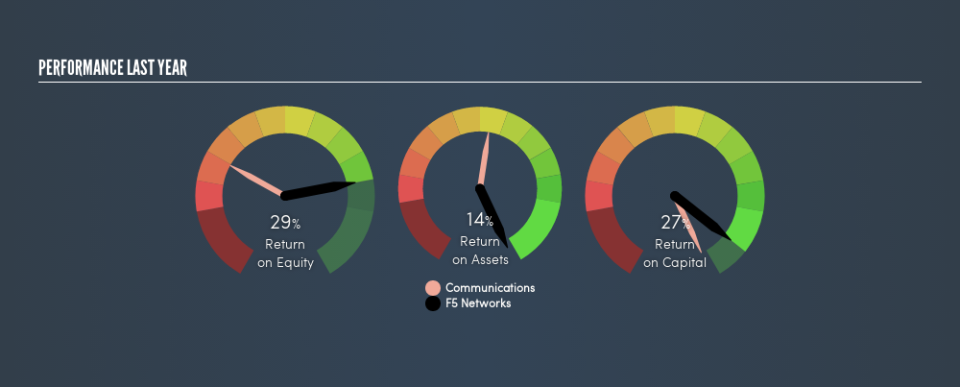
One way to assess ROCE is to compare similar companies. Using our data, we find that F5 Networks's ROCE is meaningfully better than the 6.6% average in the Communications industry. We consider this a positive sign, because it suggests it uses capital more efficiently than similar companies. Setting aside the comparison to its industry for a moment, F5 Networks's ROCE in absolute terms currently looks quite high.
We can see that , F5 Networks currently has an ROCE of 27%, less than the 37% it reported 3 years ago. Therefore we wonder if the company is facing new headwinds. You can click on the image below to see (in greater detail) how F5 Networks's past growth compares to other companies.
Remember that this metric is backwards looking - it shows what has happened in the past, and does not accurately predict the future. ROCE can be misleading for companies in cyclical industries, with returns looking impressive during the boom times, but very weak during the busts. This is because ROCE only looks at one year, instead of considering returns across a whole cycle. Future performance is what matters, and you can see analyst predictions in our free report on analyst forecasts for the company.
Do F5 Networks's Current Liabilities Skew Its ROCE?
Short term (or current) liabilities, are things like supplier invoices, overdrafts, or tax bills that need to be paid within 12 months. Due to the way the ROCE equation works, having large bills due in the near term can make it look as though a company has less capital employed, and thus a higher ROCE than usual. To counteract this, we check if a company has high current liabilities, relative to its total assets.
F5 Networks has total assets of US$3.2b and current liabilities of US$1.1b. Therefore its current liabilities are equivalent to approximately 34% of its total assets. F5 Networks's ROCE is boosted somewhat by its middling amount of current liabilities.
What We Can Learn From F5 Networks's ROCE
Still, it has a high ROCE, and may be an interesting prospect for further research. F5 Networks looks strong on this analysis, but there are plenty of other companies that could be a good opportunity . Here is a free list of companies growing earnings rapidly.
If you like to buy stocks alongside management, then you might just love this free list of companies. (Hint: insiders have been buying them).
We aim to bring you long-term focused research analysis driven by fundamental data. Note that our analysis may not factor in the latest price-sensitive company announcements or qualitative material.
If you spot an error that warrants correction, please contact the editor at editorial-team@simplywallst.com. This article by Simply Wall St is general in nature. It does not constitute a recommendation to buy or sell any stock, and does not take account of your objectives, or your financial situation. Simply Wall St has no position in the stocks mentioned. Thank you for reading.
