Do Its Financials Have Any Role To Play In Driving AAON, Inc.'s (NASDAQ:AAON) Stock Up Recently?

AAON's (NASDAQ:AAON) stock is up by a considerable 16% over the past three months. As most would know, fundamentals are what usually guide market price movements over the long-term, so we decided to look at the company's key financial indicators today to determine if they have any role to play in the recent price movement. Specifically, we decided to study AAON's ROE in this article.
Return on equity or ROE is an important factor to be considered by a shareholder because it tells them how effectively their capital is being reinvested. Simply put, it is used to assess the profitability of a company in relation to its equity capital.
See our latest analysis for AAON
How Is ROE Calculated?
Return on equity can be calculated by using the formula:
Return on Equity = Net Profit (from continuing operations) ÷ Shareholders' Equity
So, based on the above formula, the ROE for AAON is:
22% = US$71m ÷ US$323m (Based on the trailing twelve months to June 2020).
The 'return' is the amount earned after tax over the last twelve months. Another way to think of that is that for every $1 worth of equity, the company was able to earn $0.22 in profit.
What Has ROE Got To Do With Earnings Growth?
So far, we've learned that ROE is a measure of a company's profitability. Depending on how much of these profits the company reinvests or "retains", and how effectively it does so, we are then able to assess a company’s earnings growth potential. Assuming all else is equal, companies that have both a higher return on equity and higher profit retention are usually the ones that have a higher growth rate when compared to companies that don't have the same features.
A Side By Side comparison of AAON's Earnings Growth And 22% ROE
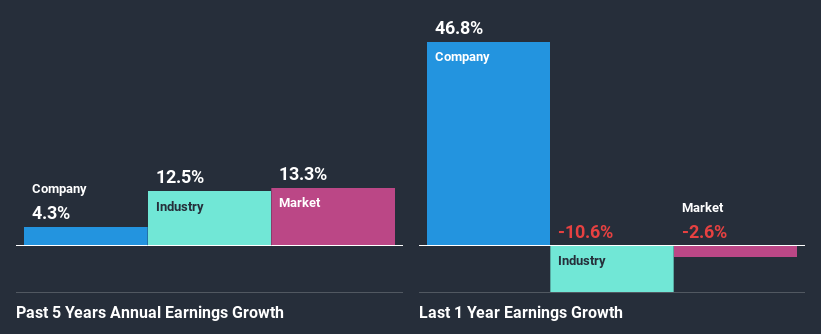
To begin with, AAON seems to have a respectable ROE. On comparing with the average industry ROE of 13% the company's ROE looks pretty remarkable. Despite this, AAON's five year net income growth was quite low averaging at only 4.3%. That's a bit unexpected from a company which has such a high rate of return. Such a scenario is likely to take place when a company pays out a huge portion of its earnings as dividends, or is faced with competitive pressures.
As a next step, we compared AAON's net income growth with the industry and were disappointed to see that the company's growth is lower than the industry average growth of 12% in the same period.
Earnings growth is a huge factor in stock valuation. The investor should try to establish if the expected growth or decline in earnings, whichever the case may be, is priced in. By doing so, they will have an idea if the stock is headed into clear blue waters or if swampy waters await. If you're wondering about AAON's's valuation, check out this gauge of its price-to-earnings ratio, as compared to its industry.
Is AAON Making Efficient Use Of Its Profits?
While AAON has a decent three-year median payout ratio of 31% (or a retention ratio of 69%), it has seen very little growth in earnings. Therefore, there might be some other reasons to explain the lack in that respect. For example, the business could be in decline.
Moreover, AAON has been paying dividends for at least ten years or more suggesting that management must have perceived that the shareholders prefer dividends over earnings growth.
Conclusion
On the whole, we do feel that AAON has some positive attributes. However, given the high ROE and high profit retention, we would expect the company to be delivering strong earnings growth, but that isn't the case here. This suggests that there might be some external threat to the business, that's hampering its growth. That being so, according to the latest industry analyst forecasts, the company's earnings are expected to shrink in the future. Are these analysts expectations based on the broad expectations for the industry, or on the company's fundamentals? Click here to be taken to our analyst's forecasts page for the company.
This article by Simply Wall St is general in nature. It does not constitute a recommendation to buy or sell any stock, and does not take account of your objectives, or your financial situation. We aim to bring you long-term focused analysis driven by fundamental data. Note that our analysis may not factor in the latest price-sensitive company announcements or qualitative material. Simply Wall St has no position in any stocks mentioned.
Have feedback on this article? Concerned about the content? Get in touch with us directly. Alternatively, email editorial-team@simplywallst.com.
