Forex Analysis: Dollar Probes Higher, S&P 500 Waits for Follow-Through
THE TAKEAWAY: The US Dollar is probing cautiously higher but a well-supported rally will need matching follow-through on bearish cues emerging in S&P 500 technical positioning.
US DOLLAR TECHNICAL ANALYSIS– Prices put in a bullish Piercing Line candlestick pattern above support at 9933, the 23.6% Fibonacci expansion, hinting a move higher is ahead. Initial resistance lines up at 9983, the underside of a rising channel set from mid-September (9980) reinforced by the 14.6% Fib (9986). A break above that targets the November 21 close at 10046. Alternatively, a drop below 9933 initially exposes the 38.2% level at 9848.
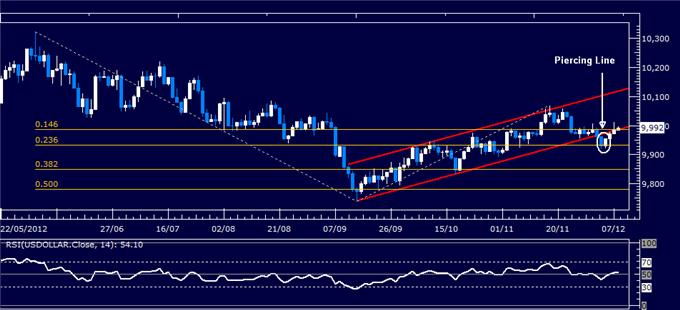
Daily Chart - Created Using FXCM Marketscope 2.0
S&P 500 TECHNICAL ANALYSIS – Prices put in a bearish Evening Star candlestick pattern below resistance in the 1424.90-1430.90 area, hinting the upward correction witnessed since mid-September may be over and the dominant down trend ready to resume (although follow-through has yet to materialize). Initial support lines up at 1406.20, the 14.6% Fibonacci expansion, with a break below that exposing the 23.6% mark at 1394.30. Alternatively, a push back above 1430.90 targets 1466.10.

Daily Chart - Created Using FXCM Marketscope 2.0
GOLD TECHNICAL ANALYSIS – Prices broke lower after putting in a Bearish Engulfing candlestick pattern, taking out support at a rising trend line set from late June. Sellers now aim to challenge the November 5 low at 1672.50. The trend line (now at 1711.06) has been recast as resistance, with a push back above that aiming to challenge 1752.55.
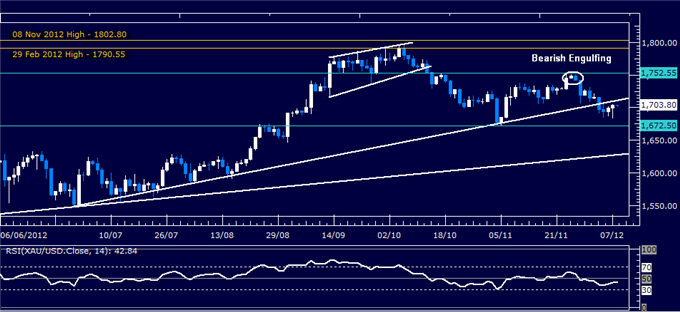
Daily Chart - Created Using FXCM Marketscope 2.0
Want to learn more about RSI? Watch this Video.
CRUDE OIL TECHNICAL ANALYSIS– Prices moved lower as expected after putting in a Shooting Star candlestick. A bearish continuation Flag chart pattern now appears to be in the works, with a break of support at 85.76 confirming the setup and initially exposing the 38.2% Fibonacci expansion at 84.04. Near-term, resistance is at 89.19. A push above that aims for the Flag top at 90.76.

Daily Chart - Created Using FXCM Marketscope 2.0
--- Written by Ilya Spivak, Currency Strategist for Dailyfx.com
To contact Ilya, e-mail ispivak@dailyfx.com. Follow Ilya on Twitter at @IlyaSpivak
To be added to Ilya's e-mail distribution list, please CLICK HERE
DailyFX provides forex news and technical analysis on the trends that influence the global currency markets.
Learn forex trading with a free practice account and trading charts from FXCM.
