Forex Analysis: USDCAD Classic Technical Report 11.09.2012
Prices put in a Bullish Engulfing candlestick pattern above rising trend line support set from mid-September and took out initial resistance lines up at 0.9965, the 23.6% Fibonacci expansion. The bulls now aim to challenge the 38.2% level at 1.0021, with a break above that exposing the 50% Fib at 1.0067. The 0.9965 level has been recast as near-term support, with a break below that aiming for the trend line at 0.9876. Overall positioning continues to favor a move to a measured upside target at 1.0140 after the pair completed an inverse Head and Shoulders bottom on October 19.
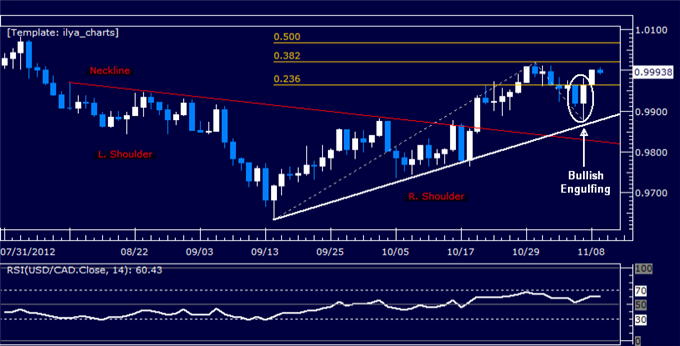
Daily Chart - Created Using FXCM Marketscope 2.0
--- Written by Ilya Spivak, Currency Strategist for Dailyfx.com
To contact Ilya, e-mail ispivak@dailyfx.com. Follow Ilya on Twitter at @IlyaSpivak
To be added to Ilya's e-mail distribution list, please CLICK HERE
New to FX? Watch this Video. For live market updates, visit the Real Time News Feed
DailyFX provides forex news and technical analysis on the trends that influence the global currency markets.
Learn forex trading with a free practice account and trading charts from FXCM.
