US Dollar Still Looking for Direction, SPX 500 at Risk of Losses
Talking Points:
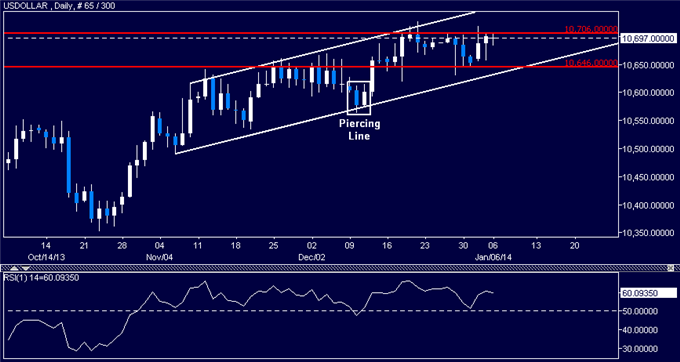
US Dollar Still Treading Water in a Familiar Range
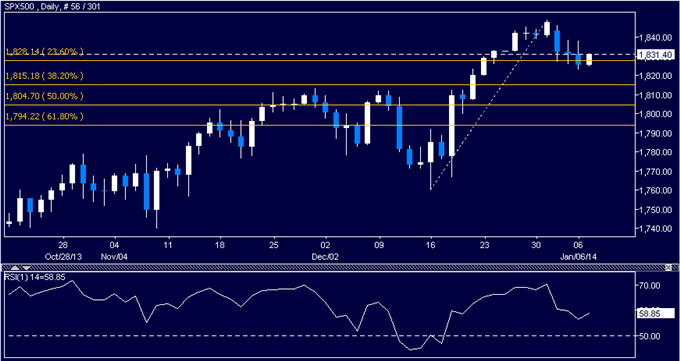
S&P 500 Chart Setup Warns of Deeper Losses Ahead
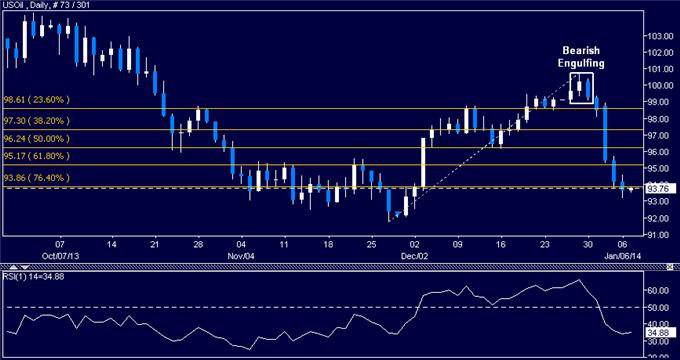
Crude Oil Aims Below $92.00 After Support Break
Can’t access to the Dow Jones FXCM US Dollar Index? Try the USD basket on Mirror Trader. **
US DOLLAR TECHNICAL ANALYSIS – Prices rose as expected after putting in a bullish Piercing Line candlestick pattern. A break above range resistance at 10706 targets 10727, the December 19 high, followed by a rising channel top at 10750. Alternatively, a move below range support at 10646 exposes the channel bottom at 10631.
** The Dow Jones FXCM US Dollar Index and the Mirror Trader USD basket are not the same product.
S&P 500 TECHNICAL ANALYSIS – Prices edged below support at 1828.14, the 23.6% Fibonacci retracement, exposing the 38.2% level 1815.18. A reversal back above 1828.14 on a daily closing basis sees the next layer of resistance is at 1849.10, the December 30 swing high.
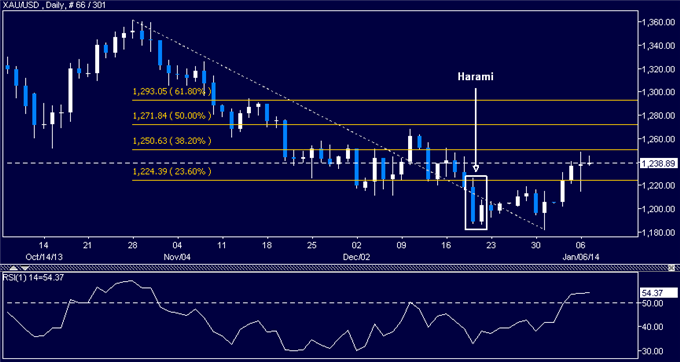
GOLD TECHNICAL ANALYSIS – Prices turned higher as expected after putting in a Harami candlestick pattern. A break above resistance at 1224.39, the 23.6% Fibonacci retracement, has exposed the 38.2% level at 1250.63. A further push beyond that aims for the 50% Fib at 1271.84. The 1224.39 mark has been recast as near-term support.
CRUDE OIL TECHNICAL ANALYSIS– Prices fell as expected after putting in a Bearish Engulfing candlestick pattern. A break below 93.86, the 76.4% Fibonacci retracement, has exposed the November 26 low at 91.74. Reversing back above 93.86 targets resistance at 95.17, the 61.8% Fib.
--- Written by Ilya Spivak, Currency Strategist for DailyFX.com
To receive Ilya's analysis directly via email, please SIGN UP HERE
Contact and follow Ilya on Twitter: @IlyaSpivak
DailyFX provides forex news and technical analysis on the trends that influence the global currency markets.
Learn forex trading with a free practice account and trading charts from FXCM.
