Should You Have Future FinTech Group Inc’s (NASDAQ:FTFT) In Your Portfolio?

If you are a shareholder in Future FinTech Group Inc’s (NASDAQ:FTFT), or are thinking about investing in the company, knowing how it contributes to the risk and reward profile of your portfolio is important. FTFT is exposed to market-wide risk, which arises from investing in the stock market. This risk reflects changes in economic and political factors that affects all stocks, and is measured by its beta. Different characteristics of a stock expose it to various levels of market risk, and the market as a whole represents a beta of one. Any stock with a beta of greater than one is considered more volatile than the market, and those with a beta less than one is generally less volatile.
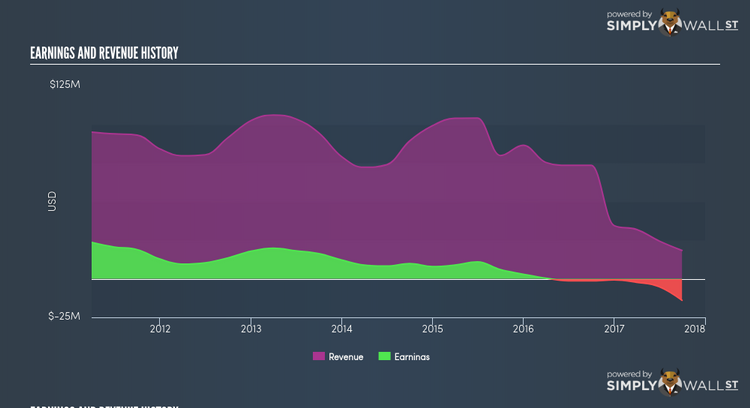
View our latest analysis for Future FinTech Group
What is FTFT’s market risk?
Future FinTech Group’s five-year beta of 3.1 means that the company’s value will swing up by more than the market during prosperous times, but also drop down by more in times of downturns. This level of volatility indicates bigger risk for investors who passively invest in the stock market index. According to this value of beta, FTFT can help magnify your portfolio return, especially if it is predominantly made up of low-beta stocks. If the market is going up, a higher exposure to the upside from a high-beta stock can push up your portfolio return.
Does FTFT’s size and industry impact the expected beta?
With a market cap of USD $20.93M, FTFT falls within the small-cap spectrum of stocks, which are found to experience higher relative risk compared to larger companies. However, FTFT operates in the food industry, which has commonly demonstrated muted reactions to market-wide shocks. As a result, we should expect a high beta for the small-cap FTFT but a low beta for the food industry. It seems as though there is an inconsistency in risks from FTFT’s size and industry. There may be a more fundamental driver which can explain this inconsistency, which we will examine below.
Can FTFT’s asset-composition point to a higher beta?
An asset-heavy company tends to have a higher beta because the risk associated with running fixed assets during a downturn is highly expensive. I examine FTFT’s ratio of fixed assets to total assets to see whether the company is highly exposed to the risk of this type of constraint. FTFT’s fixed assets to total assets ratio of higher than 30% shows that the company uses up a big chunk of its capital on assets that are hard to scale up or down in short notice. As a result, this aspect of FTFT indicates a higher beta than a similar size company with a lower portion of fixed assets on their balance sheet. This is consistent with is current beta value which also indicates high volatility.
What this means for you:
You may reap the gains of FTFT’s returns in times of an economic boom. Though the business does have higher fixed cost than what is considered safe, during times of growth, consumer demand may be high enough to not warrant immediate concerns. However, during a downturn, a more defensive stock can cushion the impact of this risk. What I have not mentioned in my article here are important company-specific fundamentals such as Future FinTech Group’s financial health and performance track record. I urge you to complete your research by taking a look at the following:
1. Financial Health: Is FTFT’s operations financially sustainable? Balance sheets can be hard to analyze, which is why we’ve done it for you. Check out our financial health checks here.
2. Past Track Record: Has FTFT been consistently performing well irrespective of the ups and downs in the market? Go into more detail in the past performance analysis and take a look at the free visual representations of FTFT’s historicals for more clarity.
3. Other High-Performing Stocks: Are there other stocks that provide better prospects with proven track records? Explore our free list of these great stocks here.
To help readers see pass the short term volatility of the financial market, we aim to bring you a long-term focused research analysis purely driven by fundamental data. Note that our analysis does not factor in the latest price sensitive company announcements.
The author is an independent contributor and at the time of publication had no position in the stocks mentioned.
