Are Gold Resource Corporation’s (NYSEMKT:GORO) Returns On Investment Worth Your While?

Today we'll look at Gold Resource Corporation (NYSEMKT:GORO) and reflect on its potential as an investment. To be precise, we'll consider its Return On Capital Employed (ROCE), as that will inform our view of the quality of the business.
First, we'll go over how we calculate ROCE. Next, we'll compare it to others in its industry. And finally, we'll look at how its current liabilities are impacting its ROCE.
Return On Capital Employed (ROCE): What is it?
ROCE is a measure of a company's yearly pre-tax profit (its return), relative to the capital employed in the business. All else being equal, a better business will have a higher ROCE. Overall, it is a valuable metric that has its flaws. Renowned investment researcher Michael Mauboussin has suggested that a high ROCE can indicate that 'one dollar invested in the company generates value of more than one dollar'.
So, How Do We Calculate ROCE?
The formula for calculating the return on capital employed is:
Return on Capital Employed = Earnings Before Interest and Tax (EBIT) ÷ (Total Assets - Current Liabilities)
Or for Gold Resource:
0.085 = US$14m ÷ (US$192m - US$26m) (Based on the trailing twelve months to September 2019.)
Therefore, Gold Resource has an ROCE of 8.5%.
See our latest analysis for Gold Resource
Does Gold Resource Have A Good ROCE?
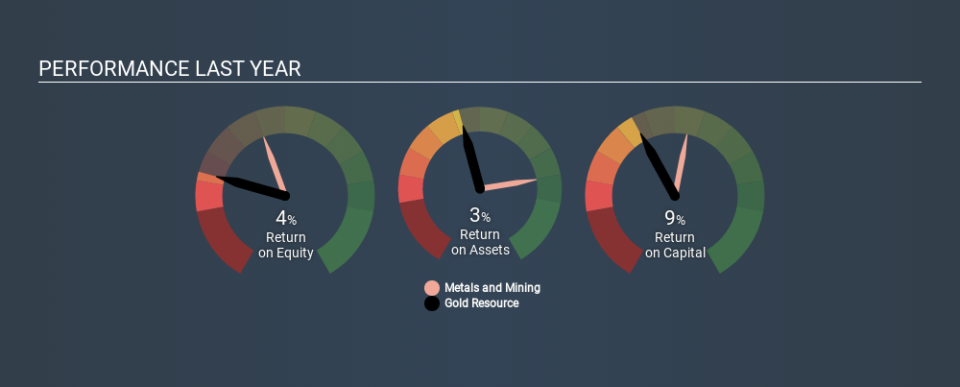
One way to assess ROCE is to compare similar companies. We can see Gold Resource's ROCE is around the 8.8% average reported by the Metals and Mining industry. Setting aside the industry comparison for now, Gold Resource's ROCE is mediocre in absolute terms, considering the risk of investing in stocks versus the safety of a bank account. Readers may find more attractive investment prospects elsewhere.
We can see that, Gold Resource currently has an ROCE of 8.5%, less than the 13% it reported 3 years ago. This makes us wonder if the business is facing new challenges. The image below shows how Gold Resource's ROCE compares to its industry, and you can click it to see more detail on its past growth.
Remember that this metric is backwards looking - it shows what has happened in the past, and does not accurately predict the future. ROCE can be deceptive for cyclical businesses, as returns can look incredible in boom times, and terribly low in downturns. ROCE is, after all, simply a snap shot of a single year. Remember that most companies like Gold Resource are cyclical businesses. What happens in the future is pretty important for investors, so we have prepared a free report on analyst forecasts for Gold Resource.
Do Gold Resource's Current Liabilities Skew Its ROCE?
Current liabilities include invoices, such as supplier payments, short-term debt, or a tax bill, that need to be paid within 12 months. Due to the way the ROCE equation works, having large bills due in the near term can make it look as though a company has less capital employed, and thus a higher ROCE than usual. To counter this, investors can check if a company has high current liabilities relative to total assets.
Gold Resource has current liabilities of US$26m and total assets of US$192m. Therefore its current liabilities are equivalent to approximately 14% of its total assets. This very reasonable level of current liabilities would not boost the ROCE by much.
The Bottom Line On Gold Resource's ROCE
That said, Gold Resource's ROCE is mediocre, there may be more attractive investments around. But note: make sure you look for a great company, not just the first idea you come across. So take a peek at this free list of interesting companies with strong recent earnings growth (and a P/E ratio below 20).
If you like to buy stocks alongside management, then you might just love this free list of companies. (Hint: insiders have been buying them).
If you spot an error that warrants correction, please contact the editor at editorial-team@simplywallst.com. This article by Simply Wall St is general in nature. It does not constitute a recommendation to buy or sell any stock, and does not take account of your objectives, or your financial situation. Simply Wall St has no position in the stocks mentioned.
We aim to bring you long-term focused research analysis driven by fundamental data. Note that our analysis may not factor in the latest price-sensitive company announcements or qualitative material. Thank you for reading.
