If You Had Bought Aperam (AMS:APAM) Stock Five Years Ago, You Could Pocket A 44% Gain Today

Want to participate in a research study? Help shape the future of investing tools and earn a $60 gift card!
When we invest, we're generally looking for stocks that outperform the market average. And the truth is, you can make significant gains if you buy good quality businesses at the right price. For example, long term Aperam S.A. (AMS:APAM) shareholders have enjoyed a 44% share price rise over the last half decade, well in excess of the market return of around 29% (not including dividends).
View our latest analysis for Aperam
While the efficient markets hypothesis continues to be taught by some, it has been proven that markets are over-reactive dynamic systems, and investors are not always rational. One imperfect but simple way to consider how the market perception of a company has shifted is to compare the change in the earnings per share (EPS) with the share price movement.
During the last half decade, Aperam became profitable. That's generally thought to be a genuine positive, so we would expect to see an increasing share price. Given that the company made a profit three years ago, but not five years ago, it is worth looking at the share price returns over the last three years, too. We can see that the Aperam share price is down 19% in the last three years. In the same period, EPS is up 19% per year. So there seems to be a mismatch between the positive EPS growth and the change in the share price, which is down -7.0% per year.
The image below shows how EPS has tracked over time (if you click on the image you can see greater detail).
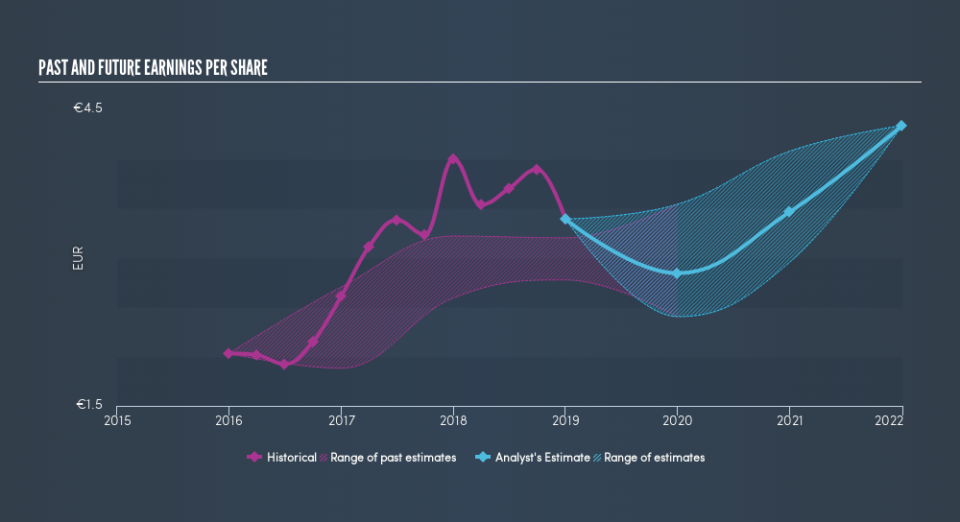
Dive deeper into Aperam's key metrics by checking this interactive graph of Aperam's earnings, revenue and cash flow.
What About Dividends?
When looking at investment returns, it is important to consider the difference between total shareholder return (TSR) and share price return. The TSR is a return calculation that accounts for the value of cash dividends (assuming that any dividend received was reinvested) and the calculated value of any discounted capital raisings and spin-offs. So for companies that pay a generous dividend, the TSR is often a lot higher than the share price return. We note that for Aperam the TSR over the last 5 years was 60%, which is better than the share price return mentioned above. This is largely a result of its dividend payments!
A Different Perspective
Investors in Aperam had a tough year, with a total loss of 29% (including dividends), against a market gain of about 9.1%. However, keep in mind that even the best stocks will sometimes underperform the market over a twelve month period. On the bright side, long term shareholders have made money, with a gain of 9.8% per year over half a decade. If the fundamental data continues to indicate long term sustainable growth, the current sell-off could be an opportunity worth considering. Keeping this in mind, a solid next step might be to take a look at Aperam's dividend track record. This free interactive graph is a great place to start.
If you are like me, then you will not want to miss this free list of growing companies that insiders are buying.
Please note, the market returns quoted in this article reflect the market weighted average returns of stocks that currently trade on NL exchanges.
We aim to bring you long-term focused research analysis driven by fundamental data. Note that our analysis may not factor in the latest price-sensitive company announcements or qualitative material.
If you spot an error that warrants correction, please contact the editor at editorial-team@simplywallst.com. This article by Simply Wall St is general in nature. It does not constitute a recommendation to buy or sell any stock, and does not take account of your objectives, or your financial situation. Simply Wall St has no position in the stocks mentioned. Thank you for reading.
