Here's How P/E Ratios Can Help Us Understand Jindal Saw Limited (NSE:JINDALSAW)

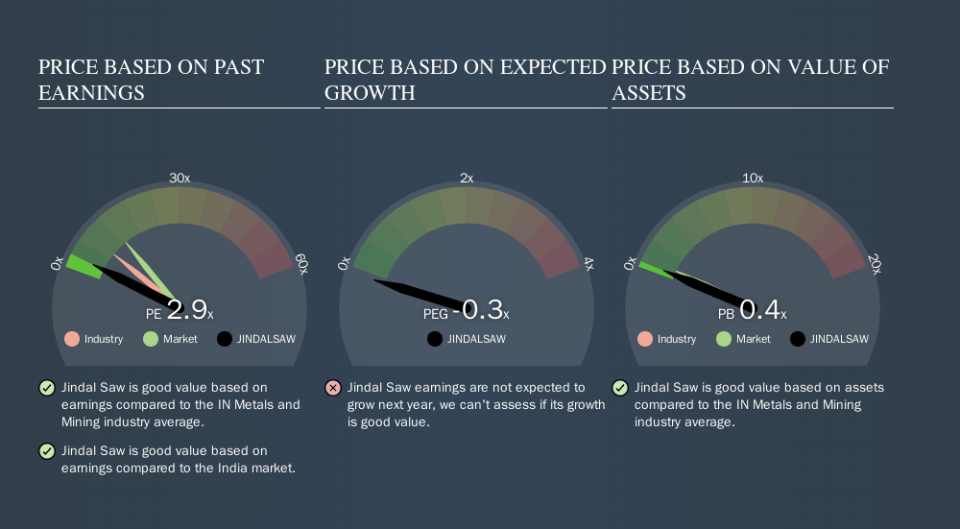
This article is for investors who would like to improve their understanding of price to earnings ratios (P/E ratios). We'll look at Jindal Saw Limited's (NSE:JINDALSAW) P/E ratio and reflect on what it tells us about the company's share price. Jindal Saw has a price to earnings ratio of 2.89, based on the last twelve months. That means that at current prices, buyers pay ₹2.89 for every ₹1 in trailing yearly profits.
View our latest analysis for Jindal Saw
How Do You Calculate Jindal Saw's P/E Ratio?
The formula for P/E is:
Price to Earnings Ratio = Price per Share ÷ Earnings per Share (EPS)
Or for Jindal Saw:
P/E of 2.89 = ₹81.50 ÷ ₹28.17 (Based on the year to June 2019.)
Is A High Price-to-Earnings Ratio Good?
A higher P/E ratio means that buyers have to pay a higher price for each ₹1 the company has earned over the last year. That is not a good or a bad thing per se, but a high P/E does imply buyers are optimistic about the future.
Does Jindal Saw Have A Relatively High Or Low P/E For Its Industry?
We can get an indication of market expectations by looking at the P/E ratio. The image below shows that Jindal Saw has a lower P/E than the average (8.3) P/E for companies in the metals and mining industry.
Its relatively low P/E ratio indicates that Jindal Saw shareholders think it will struggle to do as well as other companies in its industry classification. While current expectations are low, the stock could be undervalued if the situation is better than the market assumes. You should delve deeper. I like to check if company insiders have been buying or selling.
How Growth Rates Impact P/E Ratios
P/E ratios primarily reflect market expectations around earnings growth rates. If earnings are growing quickly, then the 'E' in the equation will increase faster than it would otherwise. And in that case, the P/E ratio itself will drop rather quickly. A lower P/E should indicate the stock is cheap relative to others -- and that may attract buyers.
Jindal Saw's 152% EPS improvement over the last year was like bamboo growth after rain; rapid and impressive. And earnings per share have improved by 272% annually, over the last three years. So you might say it really deserves to have an above-average P/E ratio.
A Limitation: P/E Ratios Ignore Debt and Cash In The Bank
One drawback of using a P/E ratio is that it considers market capitalization, but not the balance sheet. That means it doesn't take debt or cash into account. Hypothetically, a company could reduce its future P/E ratio by spending its cash (or taking on debt) to achieve higher earnings.
Such expenditure might be good or bad, in the long term, but the point here is that the balance sheet is not reflected by this ratio.
How Does Jindal Saw's Debt Impact Its P/E Ratio?
Jindal Saw's net debt is considerable, at 200% of its market cap. If you want to compare its P/E ratio to other companies, you must keep in mind that these debt levels would usually warrant a relatively low P/E.
The Verdict On Jindal Saw's P/E Ratio
Jindal Saw trades on a P/E ratio of 2.9, which is below the IN market average of 13.2. While the EPS growth last year was strong, the significant debt levels reduce the number of options available to management. If the company can continue to grow earnings, then the current P/E may be unjustifiably low.
Investors should be looking to buy stocks that the market is wrong about. As value investor Benjamin Graham famously said, 'In the short run, the market is a voting machine but in the long run, it is a weighing machine. So this free report on the analyst consensus forecasts could help you make a master move on this stock.
Of course you might be able to find a better stock than Jindal Saw. So you may wish to see this free collection of other companies that have grown earnings strongly.
We aim to bring you long-term focused research analysis driven by fundamental data. Note that our analysis may not factor in the latest price-sensitive company announcements or qualitative material.
If you spot an error that warrants correction, please contact the editor at editorial-team@simplywallst.com. This article by Simply Wall St is general in nature. It does not constitute a recommendation to buy or sell any stock, and does not take account of your objectives, or your financial situation. Simply Wall St has no position in the stocks mentioned. Thank you for reading.
