Here's How P/E Ratios Can Help Us Understand Think Childcare Limited (ASX:TNK)

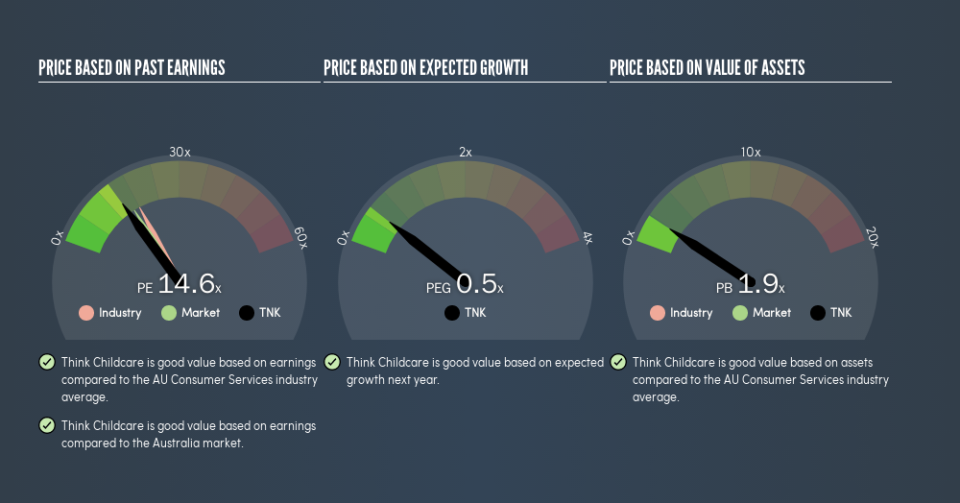
This article is for investors who would like to improve their understanding of price to earnings ratios (P/E ratios). We'll look at Think Childcare Limited's (ASX:TNK) P/E ratio and reflect on what it tells us about the company's share price. Based on the last twelve months, Think Childcare's P/E ratio is 14.58. In other words, at today's prices, investors are paying A$14.58 for every A$1 in prior year profit.
View our latest analysis for Think Childcare
How Do I Calculate A Price To Earnings Ratio?
The formula for price to earnings is:
Price to Earnings Ratio = Share Price ÷ Earnings per Share (EPS)
Or for Think Childcare:
P/E of 14.58 = A$1.53 ÷ A$0.10 (Based on the trailing twelve months to December 2018.)
Is A High Price-to-Earnings Ratio Good?
The higher the P/E ratio, the higher the price tag of a business, relative to its trailing earnings. That isn't necessarily good or bad, but a high P/E implies relatively high expectations of what a company can achieve in the future.
How Does Think Childcare's P/E Ratio Compare To Its Peers?
We can get an indication of market expectations by looking at the P/E ratio. We can see in the image below that the average P/E (18) for companies in the consumer services industry is higher than Think Childcare's P/E.
This suggests that market participants think Think Childcare will underperform other companies in its industry. Since the market seems unimpressed with Think Childcare, it's quite possible it could surprise on the upside. It is arguably worth checking if insiders are buying shares, because that might imply they believe the stock is undervalued.
How Growth Rates Impact P/E Ratios
Companies that shrink earnings per share quickly will rapidly decrease the 'E' in the equation. That means unless the share price falls, the P/E will increase in a few years. Then, a higher P/E might scare off shareholders, pushing the share price down.
Think Childcare saw earnings per share decrease by 24% last year. And EPS is down 4.8% a year, over the last 3 years. This might lead to low expectations.
Don't Forget: The P/E Does Not Account For Debt or Bank Deposits
One drawback of using a P/E ratio is that it considers market capitalization, but not the balance sheet. So it won't reflect the advantage of cash, or disadvantage of debt. Hypothetically, a company could reduce its future P/E ratio by spending its cash (or taking on debt) to achieve higher earnings.
Such spending might be good or bad, overall, but the key point here is that you need to look at debt to understand the P/E ratio in context.
So What Does Think Childcare's Balance Sheet Tell Us?
Think Childcare's net debt equates to 25% of its market capitalization. While that's enough to warrant consideration, it doesn't really concern us.
The Verdict On Think Childcare's P/E Ratio
Think Childcare trades on a P/E ratio of 14.6, which is below the AU market average of 16.2. Since it only carries a modest debt load, it's likely the low expectations implied by the P/E ratio arise from the lack of recent earnings growth.
Investors should be looking to buy stocks that the market is wrong about. As value investor Benjamin Graham famously said, 'In the short run, the market is a voting machine but in the long run, it is a weighing machine.' So this free report on the analyst consensus forecasts could help you make a master move on this stock.
Of course, you might find a fantastic investment by looking at a few good candidates. So take a peek at this free list of companies with modest (or no) debt, trading on a P/E below 20.
We aim to bring you long-term focused research analysis driven by fundamental data. Note that our analysis may not factor in the latest price-sensitive company announcements or qualitative material.
If you spot an error that warrants correction, please contact the editor at editorial-team@simplywallst.com. This article by Simply Wall St is general in nature. It does not constitute a recommendation to buy or sell any stock, and does not take account of your objectives, or your financial situation. Simply Wall St has no position in the stocks mentioned. Thank you for reading.
