Should You Like HMS Holdings Corp.’s (NASDAQ:HMSY) High Return On Capital Employed?

Today we'll evaluate HMS Holdings Corp. (NASDAQ:HMSY) to determine whether it could have potential as an investment idea. Specifically, we'll consider its Return On Capital Employed (ROCE), since that will give us an insight into how efficiently the business can generate profits from the capital it requires.
Firstly, we'll go over how we calculate ROCE. Second, we'll look at its ROCE compared to similar companies. And finally, we'll look at how its current liabilities are impacting its ROCE.
Return On Capital Employed (ROCE): What is it?
ROCE is a metric for evaluating how much pre-tax income (in percentage terms) a company earns on the capital invested in its business. All else being equal, a better business will have a higher ROCE. Ultimately, it is a useful but imperfect metric. Renowned investment researcher Michael Mauboussin has suggested that a high ROCE can indicate that 'one dollar invested in the company generates value of more than one dollar'.
How Do You Calculate Return On Capital Employed?
The formula for calculating the return on capital employed is:
Return on Capital Employed = Earnings Before Interest and Tax (EBIT) ÷ (Total Assets - Current Liabilities)
Or for HMS Holdings:
0.087 = US$91m ÷ (US$1.1b - US$87m) (Based on the trailing twelve months to March 2019.)
So, HMS Holdings has an ROCE of 8.7%.
Check out our latest analysis for HMS Holdings
Is HMS Holdings's ROCE Good?
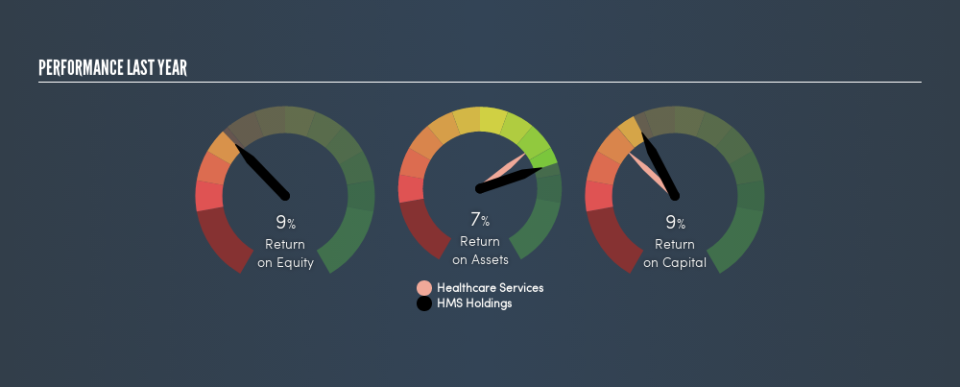
ROCE can be useful when making comparisons, such as between similar companies. In our analysis, HMS Holdings's ROCE is meaningfully higher than the 7.0% average in the Healthcare Services industry. We consider this a positive sign, because it suggests it uses capital more efficiently than similar companies. Setting aside the industry comparison for now, HMS Holdings's ROCE is mediocre in absolute terms, considering the risk of investing in stocks versus the safety of a bank account. It is possible that there are more rewarding investments out there.
Our data shows that HMS Holdings currently has an ROCE of 8.7%, compared to its ROCE of 6.4% 3 years ago. This makes us think about whether the company has been reinvesting shrewdly. The image below shows how HMS Holdings's ROCE compares to its industry, and you can click it to see more detail on its past growth.
When considering ROCE, bear in mind that it reflects the past and does not necessarily predict the future. Companies in cyclical industries can be difficult to understand using ROCE, as returns typically look high during boom times, and low during busts. This is because ROCE only looks at one year, instead of considering returns across a whole cycle. Future performance is what matters, and you can see analyst predictions in our free report on analyst forecasts for the company.
HMS Holdings's Current Liabilities And Their Impact On Its ROCE
Liabilities, such as supplier bills and bank overdrafts, are referred to as current liabilities if they need to be paid within 12 months. The ROCE equation subtracts current liabilities from capital employed, so a company with a lot of current liabilities appears to have less capital employed, and a higher ROCE than otherwise. To counter this, investors can check if a company has high current liabilities relative to total assets.
HMS Holdings has total liabilities of US$87m and total assets of US$1.1b. Therefore its current liabilities are equivalent to approximately 7.7% of its total assets. With low levels of current liabilities, at least HMS Holdings's mediocre ROCE is not unduly boosted.
Our Take On HMS Holdings's ROCE
HMS Holdings looks like an ok business, but on this analysis it is not at the top of our buy list. Of course, you might find a fantastic investment by looking at a few good candidates. So take a peek at this free list of companies with modest (or no) debt, trading on a P/E below 20.
If you like to buy stocks alongside management, then you might just love this free list of companies. (Hint: insiders have been buying them).
We aim to bring you long-term focused research analysis driven by fundamental data. Note that our analysis may not factor in the latest price-sensitive company announcements or qualitative material.
If you spot an error that warrants correction, please contact the editor at editorial-team@simplywallst.com. This article by Simply Wall St is general in nature. It does not constitute a recommendation to buy or sell any stock, and does not take account of your objectives, or your financial situation. Simply Wall St has no position in the stocks mentioned. Thank you for reading.
