Are Insiders Too Confident In EyeGate Pharmaceuticals Inc (NASDAQ:EYEG)?

EyeGate Pharmaceuticals, Inc., a clinical-stage specialty pharmaceutical company, focuses on developing and commercializing products for treating diseases and disorders of the eye. EyeGate Pharmaceuticals is one of United States’s small-cap stocks that saw some insider buying over the past three months, with insiders investing in more than 13 million shares during this period. Generally, insiders buying more shares in their own firm sends a bullish signal. A research published in The MIT Press (1998) concluded that stocks following insider buying outperformed the market by 4.5%. However, it may not be sufficient to base your investment decision merely on these signals. I’ve assessed two potential reasons behind the insiders’ latest motivation to buy more shares.
See our latest analysis for EyeGate Pharmaceuticals
Who Are The Insiders?
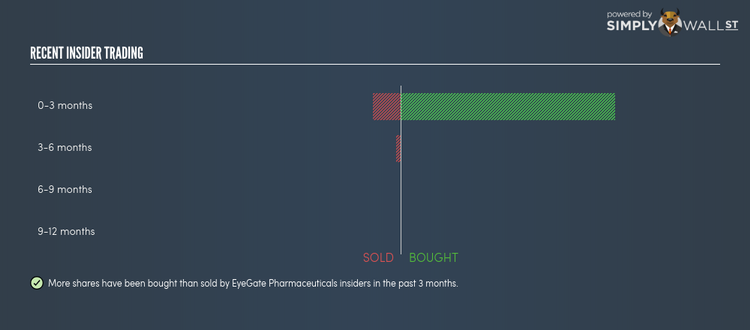
More shares have been bought than sold by EyeGate Pharmaceuticals insiders in the past three months. In total, individual insiders own over 1 million shares in the business, which makes up around 3.49% of total shares outstanding. .
The entity that bought on the open market in the last three months was
Armistice Capital LLC. Although this is an institutional investor, rather than a company executive or board member, the insights gained from direct access to management as a large investor would make it more well-informed than the average retail investor. In this specific instance, I would classify this investor as a company insider.
Is This Consistent With Future Growth?
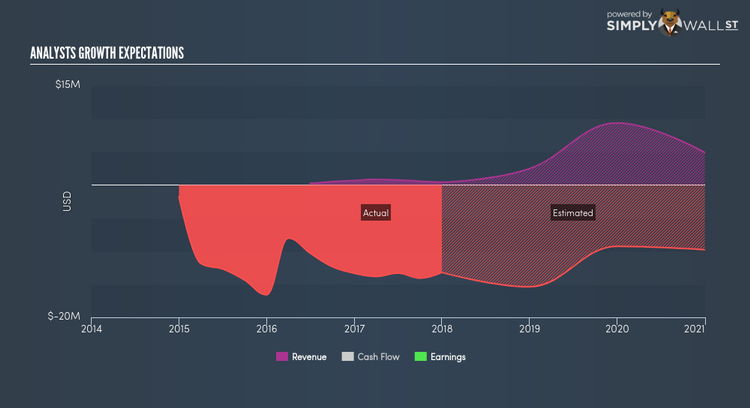
On the surface, analysts’ earnings growth projection of 65.47% over the next three years provides a strong outlook going forward which is consistent with the signal company insiders are sending with their net buying activity. Probing further into annual growth rates,EyeGate Pharmaceuticals is believed to experience a large double-digit top-line growth over the next year, which has not flown down into bottom-line expectations based on its negative growth rate of -16.32%. This indicates high levels of cost growth compared to revenues, which is typical during a period of investment and growth in the company. This seems to be supported by insiders’ conviction evidenced by their net buying activities. Or else they may simply deem the company as undervalued by the market based on future growth it could produce.
Did Stock Price Volatility Instigate Buying?
Another factor we should consider is whether the timing of these insider transactions coincide with any significant share price movements. This means, if insiders believe shares were heavily undervalued recently, this would provide a prime opportunity to buy more irrespective of its growth outlook. In the past three months, EyeGate Pharmaceuticals’s share price reached a high of $0.73 and a low of $0.33. This suggests meaningful movements in the share price with a change of 121.11%. This movement is meaningful enough to trade on if insiders believe the market has mispriced their companies’ shares.
Next Steps:
EyeGate Pharmaceuticals’s net buying tells us the stock is in favour with some insiders, although the expected earnings growth challenges this conclusion, whilst the volatile share price movement could be the incentive to transact. Although insider buying can be a useful prompt, following the lead of an insider, however, will never replace diligent research. I’ve put together two essential aspects you should look at:
Financial Health: Does EyeGate Pharmaceuticals have a healthy balance sheet? Take a look at our free balance sheet analysis with six simple checks on key factors like leverage and risk.
Other High Quality Alternatives : Are there other high quality stocks you could be holding instead of EyeGate Pharmaceuticals? Explore our interactive list of high quality stocks to get an idea of what else is out there you may be missing!
NB: Figures in this article are calculated using data from the last twelve months, which refer to the 12-month period ending on the last date of the month the financial statement is dated. This may not be consistent with full year annual report figures.
To help readers see pass the short term volatility of the financial market, we aim to bring you a long-term focused research analysis purely driven by fundamental data. Note that our analysis does not factor in the latest price sensitive company announcements.
The author is an independent contributor and at the time of publication had no position in the stocks mentioned.
