What Investors Should Know About Hillenbrand, Inc.’s (NYSE:HI) Financial Strength

Want to participate in a short research study? Help shape the future of investing tools and you could win a $250 gift card!
Small-caps and large-caps are wildly popular among investors; however, mid-cap stocks, such as Hillenbrand, Inc. (NYSE:HI) with a market-capitalization of US$2.7b, rarely draw their attention. While they are less talked about as an investment category, mid-cap risk-adjusted returns have generally been better than more commonly focused stocks that fall into the small- or large-cap categories. HI’s financial liquidity and debt position will be analysed in this article, to get an idea of whether the company can fund opportunities for strategic growth and maintain strength through economic downturns. Don’t forget that this is a general and concentrated examination of Hillenbrand’s financial health, so you should conduct further analysis into HI here.
See our latest analysis for Hillenbrand
How does HI’s operating cash flow stack up against its debt?
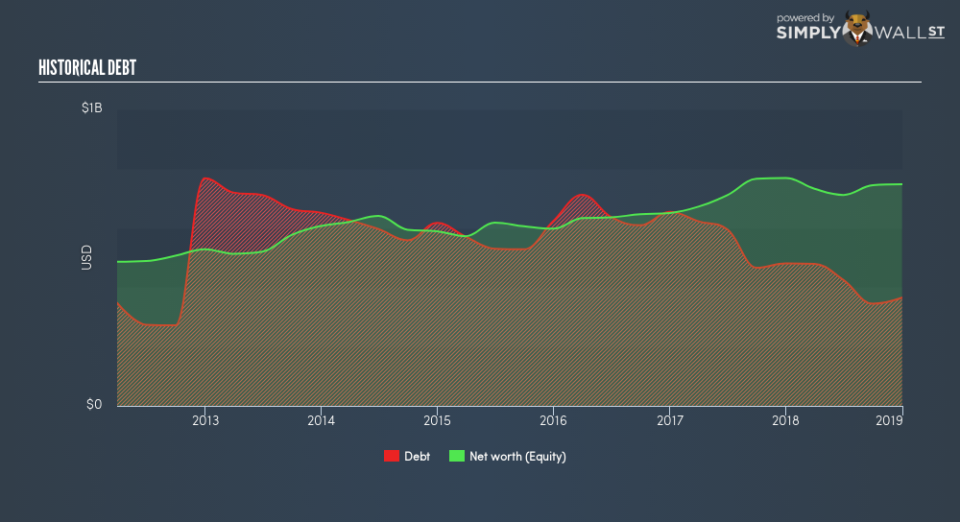
HI’s debt levels have fallen from US$481m to US$365m over the last 12 months , which also accounts for long term debt. With this debt repayment, HI currently has US$65m remaining in cash and short-term investments , ready to deploy into the business. On top of this, HI has generated cash from operations of US$257m in the last twelve months, leading to an operating cash to total debt ratio of 70%, signalling that HI’s operating cash is sufficient to cover its debt. This ratio can also be interpreted as a measure of efficiency as an alternative to return on assets. In HI’s case, it is able to generate 0.7x cash from its debt capital.
Does HI’s liquid assets cover its short-term commitments?
At the current liabilities level of US$511m, it seems that the business has been able to meet these obligations given the level of current assets of US$613m, with a current ratio of 1.2x. Usually, for Machinery companies, this is a suitable ratio since there is a bit of a cash buffer without leaving too much capital in a low-return environment.
Can HI service its debt comfortably?
HI is a relatively highly levered company with a debt-to-equity of 49%. This is not uncommon for a mid-cap company given that debt tends to be lower-cost and at times, more accessible. We can test if HI’s debt levels are sustainable by measuring interest payments against earnings of a company. Ideally, earnings before interest and tax (EBIT) should cover net interest by at least three times. For HI, the ratio of 10.51x suggests that interest is comfortably covered, which means that lenders may be inclined to lend more money to the company, as it is seen as safe in terms of payback.
Next Steps:
Although HI’s debt level is towards the higher end of the spectrum, its cash flow coverage seems adequate to meet obligations which means its debt is being efficiently utilised. This may mean this is an optimal capital structure for the business, given that it is also meeting its short-term commitment. I admit this is a fairly basic analysis for HI’s financial health. Other important fundamentals need to be considered alongside. I suggest you continue to research Hillenbrand to get a more holistic view of the mid-cap by looking at:
Future Outlook: What are well-informed industry analysts predicting for HI’s future growth? Take a look at our free research report of analyst consensus for HI’s outlook.
Valuation: What is HI worth today? Is the stock undervalued, even when its growth outlook is factored into its intrinsic value? The intrinsic value infographic in our free research report helps visualize whether HI is currently mispriced by the market.
Other High-Performing Stocks: Are there other stocks that provide better prospects with proven track records? Explore our free list of these great stocks here.
To help readers see past the short term volatility of the financial market, we aim to bring you a long-term focused research analysis purely driven by fundamental data. Note that our analysis does not factor in the latest price-sensitive company announcements.
The author is an independent contributor and at the time of publication had no position in the stocks mentioned. For errors that warrant correction please contact the editor at editorial-team@simplywallst.com.
