What Kind Of Investors Own Most Of Pitney Bowes Inc. (NYSE:PBI)?
The big shareholder groups in Pitney Bowes Inc. (NYSE:PBI) have power over the company. Generally speaking, as a company grows, institutions will increase their ownership. Conversely, insiders often decrease their ownership over time. I generally like to see some degree of insider ownership, even if only a little. As Nassim Nicholas Taleb said, 'Don’t tell me what you think, tell me what you have in your portfolio.
Pitney Bowes has a market capitalization of US$868m, so we would expect some institutional investors to have noticed the stock. In the chart below, we can see that institutional investors have bought into the company. We can zoom in on the different ownership groups, to learn more about Pitney Bowes.
Check out our latest analysis for Pitney Bowes
What Does The Institutional Ownership Tell Us About Pitney Bowes?
Institutional investors commonly compare their own returns to the returns of a commonly followed index. So they generally do consider buying larger companies that are included in the relevant benchmark index.
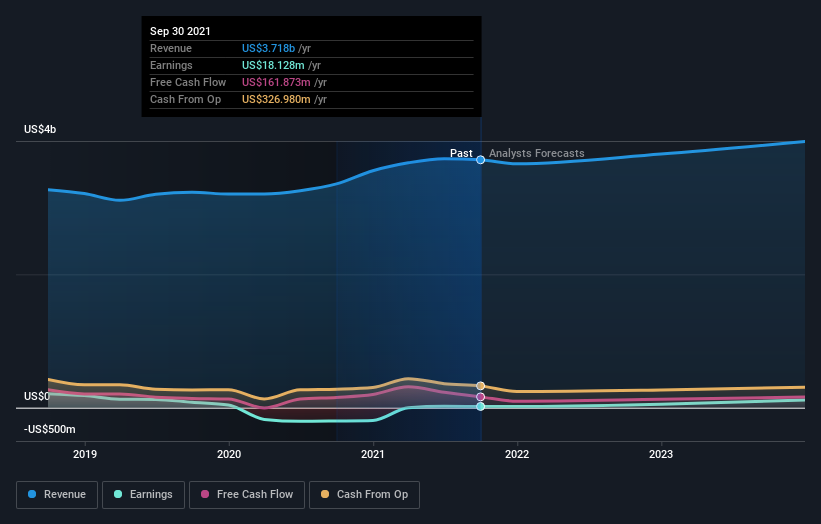
Pitney Bowes already has institutions on the share registry. Indeed, they own a respectable stake in the company. This implies the analysts working for those institutions have looked at the stock and they like it. But just like anyone else, they could be wrong. If multiple institutions change their view on a stock at the same time, you could see the share price drop fast. It's therefore worth looking at Pitney Bowes' earnings history below. Of course, the future is what really matters.
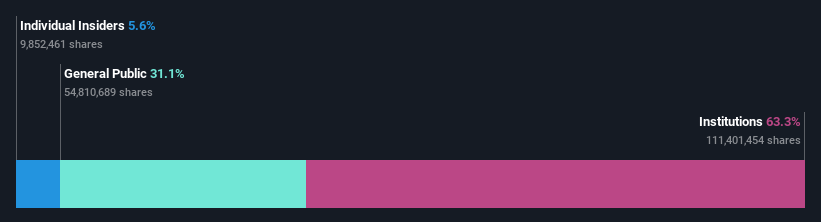
Institutional investors own over 50% of the company, so together than can probably strongly influence board decisions. Hedge funds don't have many shares in Pitney Bowes. The Vanguard Group, Inc. is currently the largest shareholder, with 11% of shares outstanding. Meanwhile, the second and third largest shareholders, hold 9.6% and 4.7%, of the shares outstanding, respectively.
A closer look at our ownership figures suggests that the top 22 shareholders have a combined ownership of 50% implying that no single shareholder has a majority.
While studying institutional ownership for a company can add value to your research, it is also a good practice to research analyst recommendations to get a deeper understand of a stock's expected performance. There are plenty of analysts covering the stock, so it might be worth seeing what they are forecasting, too.
Insider Ownership Of Pitney Bowes
The definition of company insiders can be subjective and does vary between jurisdictions. Our data reflects individual insiders, capturing board members at the very least. Company management run the business, but the CEO will answer to the board, even if he or she is a member of it.
I generally consider insider ownership to be a good thing. However, on some occasions it makes it more difficult for other shareholders to hold the board accountable for decisions.
Shareholders would probably be interested to learn that insiders own shares in Pitney Bowes Inc.. It has a market capitalization of just US$868m, and insiders have US$49m worth of shares, in their own names. Some would say this shows alignment of interests between shareholders and the board. But it might be worth checking if those insiders have been selling.
General Public Ownership
The general public, who are usually individual investors, hold a 31% stake in Pitney Bowes. This size of ownership, while considerable, may not be enough to change company policy if the decision is not in sync with other large shareholders.
Next Steps:
While it is well worth considering the different groups that own a company, there are other factors that are even more important. To that end, you should learn about the 4 warning signs we've spotted with Pitney Bowes (including 1 which is significant) .
Ultimately the future is most important. You can access this free report on analyst forecasts for the company.
NB: Figures in this article are calculated using data from the last twelve months, which refer to the 12-month period ending on the last date of the month the financial statement is dated. This may not be consistent with full year annual report figures.
Have feedback on this article? Concerned about the content? Get in touch with us directly. Alternatively, email editorial-team (at) simplywallst.com.
This article by Simply Wall St is general in nature. We provide commentary based on historical data and analyst forecasts only using an unbiased methodology and our articles are not intended to be financial advice. It does not constitute a recommendation to buy or sell any stock, and does not take account of your objectives, or your financial situation. We aim to bring you long-term focused analysis driven by fundamental data. Note that our analysis may not factor in the latest price-sensitive company announcements or qualitative material. Simply Wall St has no position in any stocks mentioned.
