What Kind Of Shareholder Appears On The Synergy Group Holdings International Limited's (HKG:1539) Shareholder Register?

The big shareholder groups in Synergy Group Holdings International Limited (HKG:1539) have power over the company. Large companies usually have institutions as shareholders, and we usually see insiders owning shares in smaller companies. Companies that used to be publicly owned tend to have lower insider ownership.
With a market capitalization of HK$215m, Synergy Group Holdings International is a small cap stock, so it might not be well known by many institutional investors. Taking a look at our data on the ownership groups (below), it's seems that institutions are noticeable on the share registry. We can zoom in on the different ownership groups, to learn more about 1539.
View our latest analysis for Synergy Group Holdings International
What Does The Institutional Ownership Tell Us About Synergy Group Holdings International?
Institutions typically measure themselves against a benchmark when reporting to their own investors, so they often become more enthusiastic about a stock once it's included in a major index. We would expect most companies to have some institutions on the register, especially if they are growing.
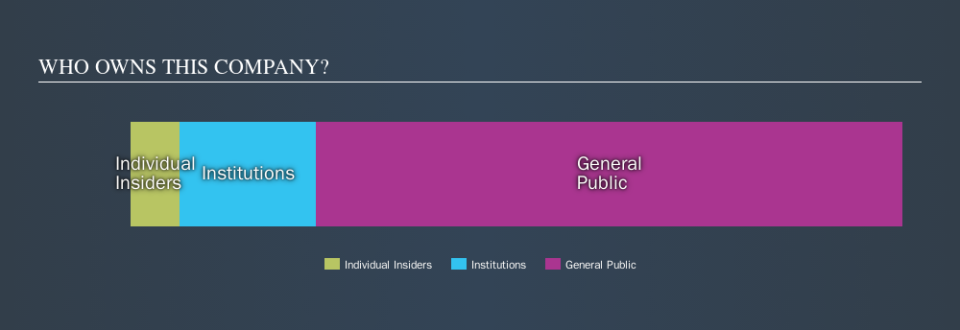
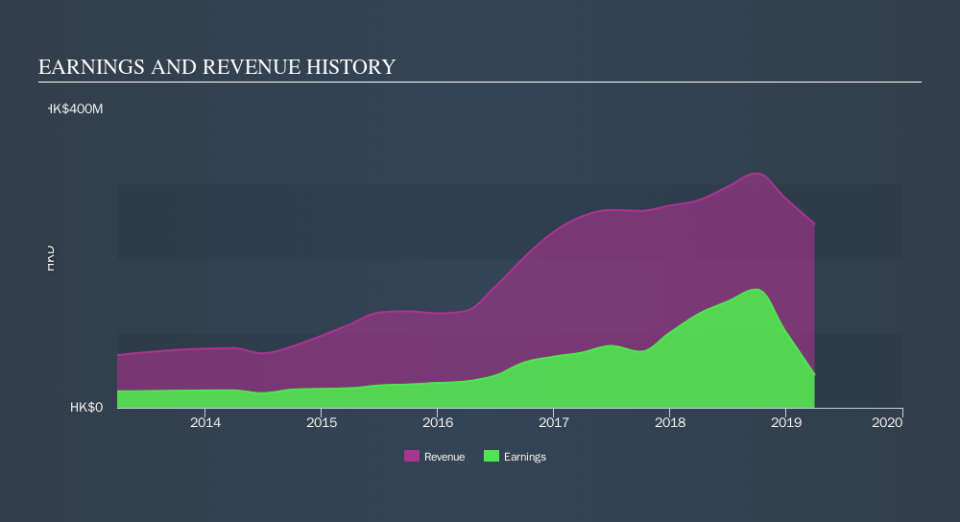
We can see that Synergy Group Holdings International does have institutional investors; and they hold 20% of the stock. This can indicate that the company has a certain degree of credibility in the investment community. However, it is best to be wary of relying on the supposed validation that comes with institutional investors. They too, get it wrong sometimes. It is not uncommon to see a big share price drop if two large institutional investors try to sell out of a stock at the same time. So it is worth checking the past earnings trajectory of Synergy Group Holdings International, (below). Of course, keep in mind that there are other factors to consider, too.
We note that hedge funds don't have a meaningful investment in Synergy Group Holdings International. Our information suggests that there isn't any analyst coverage of the stock, so it is probably little known.
Insider Ownership Of Synergy Group Holdings International
The definition of an insider can differ slightly between different countries, but members of the board of directors always count. Company management run the business, but the CEO will answer to the board, even if he or she is a member of it.
Insider ownership is positive when it signals leadership are thinking like the true owners of the company. However, high insider ownership can also give immense power to a small group within the company. This can be negative in some circumstances.
Our most recent data indicates that insiders own less than 1% of Synergy Group Holdings International Limited. It has a market capitalization of just HK$215m, and the board has only -HK$15.3m worth of shares in their own names. Many investors in smaller companies prefer to see the board more heavily invested. You can click here to see if those insiders have been buying or selling.
General Public Ownership
The general public, who are mostly retail investors, collectively hold 87% of Synergy Group Holdings International shares. This size of ownership gives retail investors collective power. They can and probably do influence decisions on executive compensation, dividend policies and proposed business acquisitions.
Next Steps:
I find it very interesting to look at who exactly owns a company. But to truly gain insight, we need to consider other information, too.
Many find it useful to take an in depth look at how a company has performed in the past. You can access this detailed graph of past earnings, revenue and cash flow.
Of course this may not be the best stock to buy. Therefore, you may wish to see our free collection of interesting prospects boasting favorable financials.
NB: Figures in this article are calculated using data from the last twelve months, which refer to the 12-month period ending on the last date of the month the financial statement is dated. This may not be consistent with full year annual report figures.
We aim to bring you long-term focused research analysis driven by fundamental data. Note that our analysis may not factor in the latest price-sensitive company announcements or qualitative material.
If you spot an error that warrants correction, please contact the editor at editorial-team@simplywallst.com. This article by Simply Wall St is general in nature. It does not constitute a recommendation to buy or sell any stock, and does not take account of your objectives, or your financial situation. Simply Wall St has no position in the stocks mentioned. Thank you for reading.
