Kip McGrath Education Centres Limited (ASX:KME) Is Going Strong But Fundamentals Appear To Be Mixed : Is There A Clear Direction For The Stock?
Most readers would already be aware that Kip McGrath Education Centres' (ASX:KME) stock increased significantly by 5.6% over the past month. However, we decided to pay attention to the company's fundamentals which don't appear to give a clear sign about the company's financial health. Specifically, we decided to study Kip McGrath Education Centres' ROE in this article.
Return on equity or ROE is an important factor to be considered by a shareholder because it tells them how effectively their capital is being reinvested. Simply put, it is used to assess the profitability of a company in relation to its equity capital.
View our latest analysis for Kip McGrath Education Centres
How Is ROE Calculated?
The formula for ROE is:
Return on Equity = Net Profit (from continuing operations) ÷ Shareholders' Equity
So, based on the above formula, the ROE for Kip McGrath Education Centres is:
9.3% = AU$1.8m ÷ AU$20m (Based on the trailing twelve months to December 2021).
The 'return' is the profit over the last twelve months. So, this means that for every A$1 of its shareholder's investments, the company generates a profit of A$0.09.
What Has ROE Got To Do With Earnings Growth?
So far, we've learned that ROE is a measure of a company's profitability. Based on how much of its profits the company chooses to reinvest or "retain", we are then able to evaluate a company's future ability to generate profits. Assuming all else is equal, companies that have both a higher return on equity and higher profit retention are usually the ones that have a higher growth rate when compared to companies that don't have the same features.
A Side By Side comparison of Kip McGrath Education Centres' Earnings Growth And 9.3% ROE
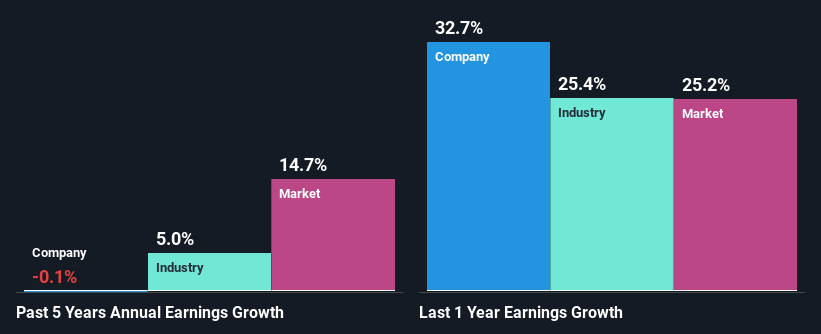
When you first look at it, Kip McGrath Education Centres' ROE doesn't look that attractive. However, the fact that the company's ROE is higher than the average industry ROE of 7.1%, is definitely interesting. However, Kip McGrath Education Centres has seen a flattish net income growth over the past five years, which is not saying much. Bear in mind, the company does have a slightly low ROE. It is just that the industry ROE is lower. So that could be one of the factors that are causing earnings growth to stay flat.
Next, on comparing with the industry net income growth, we found that the industry grew its earnings by5.0% in the same period.
The basis for attaching value to a company is, to a great extent, tied to its earnings growth. The investor should try to establish if the expected growth or decline in earnings, whichever the case may be, is priced in. This then helps them determine if the stock is placed for a bright or bleak future. One good indicator of expected earnings growth is the P/E ratio which determines the price the market is willing to pay for a stock based on its earnings prospects. So, you may want to check if Kip McGrath Education Centres is trading on a high P/E or a low P/E, relative to its industry.
Is Kip McGrath Education Centres Using Its Retained Earnings Effectively?
The high three-year median payout ratio of 60% (meaning, the company retains only 40% of profits) for Kip McGrath Education Centres suggests that the company's earnings growth was miniscule as a result of paying out a majority of its earnings.
Moreover, Kip McGrath Education Centres has been paying dividends for seven years, which is a considerable amount of time, suggesting that management must have perceived that the shareholders prefer dividends over earnings growth.
Conclusion
Overall, we have mixed feelings about Kip McGrath Education Centres. Specifically, the low earnings growth is a bit concerning, especially given that the company has a respectable rate of return. Investors may have benefitted, had the company been reinvesting more of its earnings. As discussed earlier, the company is retaining a small portion of its profits. Until now, we have only just grazed the surface of the company's past performance by looking at the company's fundamentals. So it may be worth checking this free detailed graph of Kip McGrath Education Centres' past earnings, as well as revenue and cash flows to get a deeper insight into the company's performance.
Have feedback on this article? Concerned about the content? Get in touch with us directly. Alternatively, email editorial-team (at) simplywallst.com.
This article by Simply Wall St is general in nature. We provide commentary based on historical data and analyst forecasts only using an unbiased methodology and our articles are not intended to be financial advice. It does not constitute a recommendation to buy or sell any stock, and does not take account of your objectives, or your financial situation. We aim to bring you long-term focused analysis driven by fundamental data. Note that our analysis may not factor in the latest price-sensitive company announcements or qualitative material. Simply Wall St has no position in any stocks mentioned.
Join A Paid User Research Session
You’ll receive a US$30 Amazon Gift card for 1 hour of your time while helping us build better investing tools for the individual investors like yourself. Sign up here
