Do You Know About HangKan Group Limited’s (HKG:8331) ROCE?

Today we'll look at HangKan Group Limited (HKG:8331) and reflect on its potential as an investment. Specifically, we'll consider its Return On Capital Employed (ROCE), since that will give us an insight into how efficiently the business can generate profits from the capital it requires.
Firstly, we'll go over how we calculate ROCE. Then we'll compare its ROCE to similar companies. And finally, we'll look at how its current liabilities are impacting its ROCE.
Return On Capital Employed (ROCE): What is it?
ROCE measures the 'return' (pre-tax profit) a company generates from capital employed in its business. Generally speaking a higher ROCE is better. In brief, it is a useful tool, but it is not without drawbacks. Author Edwin Whiting says to be careful when comparing the ROCE of different businesses, since 'No two businesses are exactly alike.
So, How Do We Calculate ROCE?
The formula for calculating the return on capital employed is:
Return on Capital Employed = Earnings Before Interest and Tax (EBIT) ÷ (Total Assets - Current Liabilities)
Or for HangKan Group:
0.071 = CN¥6.3m ÷ (CN¥110m - CN¥21m) (Based on the trailing twelve months to December 2019.)
Therefore, HangKan Group has an ROCE of 7.1%.
Check out our latest analysis for HangKan Group
Does HangKan Group Have A Good ROCE?
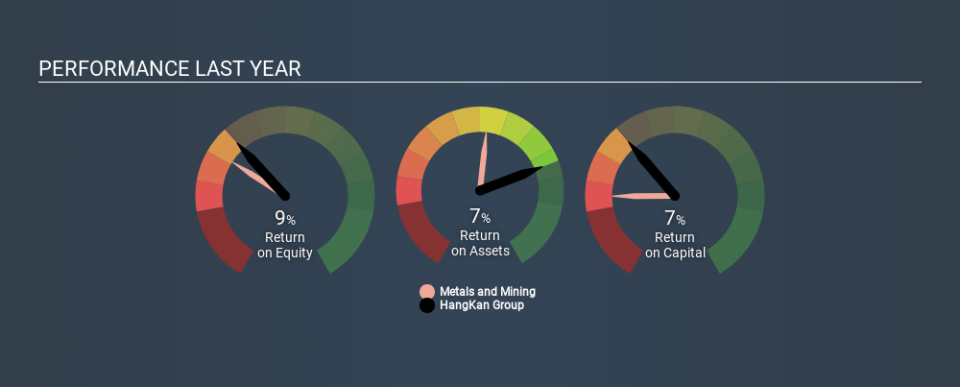
ROCE can be useful when making comparisons, such as between similar companies. It appears that HangKan Group's ROCE is fairly close to the Metals and Mining industry average of 6.9%. Aside from the industry comparison, HangKan Group's ROCE is mediocre in absolute terms, considering the risk of investing in stocks versus the safety of a bank account. It is possible that there are more rewarding investments out there.
In our analysis, HangKan Group's ROCE appears to be 7.1%, compared to 3 years ago, when its ROCE was 1.2%. This makes us think the business might be improving. You can see in the image below how HangKan Group's ROCE compares to its industry. Click to see more on past growth.
When considering ROCE, bear in mind that it reflects the past and does not necessarily predict the future. ROCE can be misleading for companies in cyclical industries, with returns looking impressive during the boom times, but very weak during the busts. ROCE is, after all, simply a snap shot of a single year. Remember that most companies like HangKan Group are cyclical businesses. You can check if HangKan Group has cyclical profits by looking at this free graph of past earnings, revenue and cash flow.
How HangKan Group's Current Liabilities Impact Its ROCE
Short term (or current) liabilities, are things like supplier invoices, overdrafts, or tax bills that need to be paid within 12 months. Due to the way the ROCE equation works, having large bills due in the near term can make it look as though a company has less capital employed, and thus a higher ROCE than usual. To check the impact of this, we calculate if a company has high current liabilities relative to its total assets.
HangKan Group has total assets of CN¥110m and current liabilities of CN¥21m. As a result, its current liabilities are equal to approximately 19% of its total assets. This very reasonable level of current liabilities would not boost the ROCE by much.
Our Take On HangKan Group's ROCE
With that in mind, we're not overly impressed with HangKan Group's ROCE, so it may not be the most appealing prospect. But note: make sure you look for a great company, not just the first idea you come across. So take a peek at this free list of interesting companies with strong recent earnings growth (and a P/E ratio below 20).
If you are like me, then you will not want to miss this free list of growing companies that insiders are buying.
If you spot an error that warrants correction, please contact the editor at editorial-team@simplywallst.com. This article by Simply Wall St is general in nature. It does not constitute a recommendation to buy or sell any stock, and does not take account of your objectives, or your financial situation. Simply Wall St has no position in the stocks mentioned.
We aim to bring you long-term focused research analysis driven by fundamental data. Note that our analysis may not factor in the latest price-sensitive company announcements or qualitative material. Thank you for reading.
