What You Need To Know About Red River Bancshares, Inc.'s (NASDAQ:RRBI) Investor Composition
Every investor in Red River Bancshares, Inc. (NASDAQ:RRBI) should be aware of the most powerful shareholder groups. Large companies usually have institutions as shareholders, and we usually see insiders owning shares in smaller companies. I quite like to see at least a little bit of insider ownership. As Charlie Munger said 'Show me the incentive and I will show you the outcome.
With a market capitalization of US$384m, Red River Bancshares is a small cap stock, so it might not be well known by many institutional investors. Our analysis of the ownership of the company, below, shows that institutions are noticeable on the share registry. We can zoom in on the different ownership groups, to learn more about Red River Bancshares.
See our latest analysis for Red River Bancshares

What Does The Institutional Ownership Tell Us About Red River Bancshares?
Institutional investors commonly compare their own returns to the returns of a commonly followed index. So they generally do consider buying larger companies that are included in the relevant benchmark index.
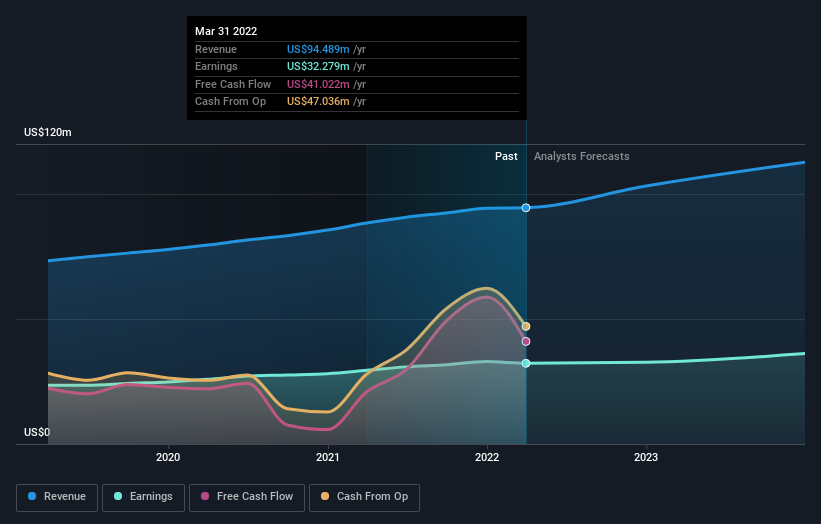
Red River Bancshares already has institutions on the share registry. Indeed, they own a respectable stake in the company. This implies the analysts working for those institutions have looked at the stock and they like it. But just like anyone else, they could be wrong. It is not uncommon to see a big share price drop if two large institutional investors try to sell out of a stock at the same time. So it is worth checking the past earnings trajectory of Red River Bancshares, (below). Of course, keep in mind that there are other factors to consider, too.
Red River Bancshares is not owned by hedge funds. Simeon Thibeaux is currently the largest shareholder, with 12% of shares outstanding. Meanwhile, the second and third largest shareholders, hold 6.0% and 5.7%, of the shares outstanding, respectively. In addition, we found that Ronald Chatelain, the CEO has 2.2% of the shares allocated to their name.
A deeper look at our ownership data shows that the top 25 shareholders collectively hold less than half of the register, suggesting a large group of small holders where no single shareholder has a majority.
While studying institutional ownership for a company can add value to your research, it is also a good practice to research analyst recommendations to get a deeper understand of a stock's expected performance. There is a little analyst coverage of the stock, but not much. So there is room for it to gain more coverage.
Insider Ownership Of Red River Bancshares
While the precise definition of an insider can be subjective, almost everyone considers board members to be insiders. The company management answer to the board and the latter should represent the interests of shareholders. Notably, sometimes top-level managers are on the board themselves.
I generally consider insider ownership to be a good thing. However, on some occasions it makes it more difficult for other shareholders to hold the board accountable for decisions.
It seems insiders own a significant proportion of Red River Bancshares, Inc.. Insiders have a US$130m stake in this US$384m business. We would say this shows alignment with shareholders, but it is worth noting that the company is still quite small; some insiders may have founded the business. You can click here to see if those insiders have been buying or selling.
General Public Ownership
The general public-- including retail investors -- own 46% stake in the company, and hence can't easily be ignored. While this size of ownership may not be enough to sway a policy decision in their favour, they can still make a collective impact on company policies.
Next Steps:
I find it very interesting to look at who exactly owns a company. But to truly gain insight, we need to consider other information, too.
I like to dive deeper into how a company has performed in the past. You can find historic revenue and earnings in this detailed graph.
If you would prefer discover what analysts are predicting in terms of future growth, do not miss this free report on analyst forecasts.
NB: Figures in this article are calculated using data from the last twelve months, which refer to the 12-month period ending on the last date of the month the financial statement is dated. This may not be consistent with full year annual report figures.
Have feedback on this article? Concerned about the content? Get in touch with us directly. Alternatively, email editorial-team (at) simplywallst.com.
This article by Simply Wall St is general in nature. We provide commentary based on historical data and analyst forecasts only using an unbiased methodology and our articles are not intended to be financial advice. It does not constitute a recommendation to buy or sell any stock, and does not take account of your objectives, or your financial situation. We aim to bring you long-term focused analysis driven by fundamental data. Note that our analysis may not factor in the latest price-sensitive company announcements or qualitative material. Simply Wall St has no position in any stocks mentioned.
