Do You Know What Western Alliance Bancorporation's (NYSE:WAL) P/E Ratio Means?

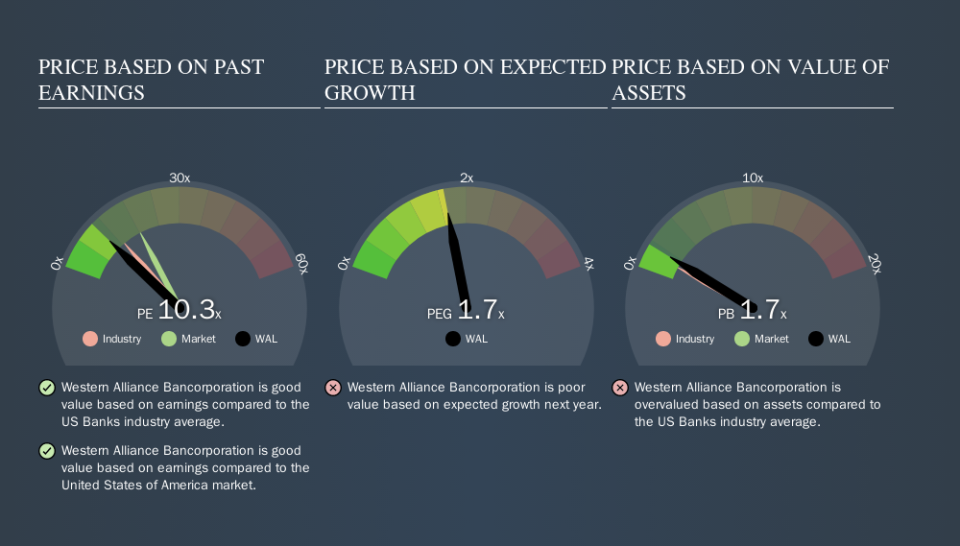
Today, we'll introduce the concept of the P/E ratio for those who are learning about investing. We'll show how you can use Western Alliance Bancorporation's (NYSE:WAL) P/E ratio to inform your assessment of the investment opportunity. Based on the last twelve months, Western Alliance Bancorporation's P/E ratio is 10.26. That is equivalent to an earnings yield of about 9.8%.
See our latest analysis for Western Alliance Bancorporation
How Do You Calculate A P/E Ratio?
The formula for P/E is:
Price to Earnings Ratio = Price per Share ÷ Earnings per Share (EPS)
Or for Western Alliance Bancorporation:
P/E of 10.26 = $46.68 ÷ $4.55 (Based on the year to June 2019.)
Is A High Price-to-Earnings Ratio Good?
The higher the P/E ratio, the higher the price tag of a business, relative to its trailing earnings. That isn't necessarily good or bad, but a high P/E implies relatively high expectations of what a company can achieve in the future.
Does Western Alliance Bancorporation Have A Relatively High Or Low P/E For Its Industry?
The P/E ratio indicates whether the market has higher or lower expectations of a company. We can see in the image below that the average P/E (12.6) for companies in the banks industry is higher than Western Alliance Bancorporation's P/E.
Western Alliance Bancorporation's P/E tells us that market participants think it will not fare as well as its peers in the same industry. Since the market seems unimpressed with Western Alliance Bancorporation, it's quite possible it could surprise on the upside. You should delve deeper. I like to check if company insiders have been buying or selling.
How Growth Rates Impact P/E Ratios
Probably the most important factor in determining what P/E a company trades on is the earnings growth. Earnings growth means that in the future the 'E' will be higher. That means unless the share price increases, the P/E will reduce in a few years. So while a stock may look expensive based on past earnings, it could be cheap based on future earnings.
It's nice to see that Western Alliance Bancorporation grew EPS by a stonking 26% in the last year. And earnings per share have improved by 25% annually, over the last five years. I'd therefore be a little surprised if its P/E ratio was not relatively high.
A Limitation: P/E Ratios Ignore Debt and Cash In The Bank
The 'Price' in P/E reflects the market capitalization of the company. Thus, the metric does not reflect cash or debt held by the company. In theory, a company can lower its future P/E ratio by using cash or debt to invest in growth.
While growth expenditure doesn't always pay off, the point is that it is a good option to have; but one that the P/E ratio ignores.
Is Debt Impacting Western Alliance Bancorporation's P/E?
Western Alliance Bancorporation has net cash of US$605m. This is fairly high at 13% of its market capitalization. That might mean balance sheet strength is important to the business, but should also help push the P/E a bit higher than it would otherwise be.
The Verdict On Western Alliance Bancorporation's P/E Ratio
Western Alliance Bancorporation has a P/E of 10.3. That's below the average in the US market, which is 18.1. It grew its EPS nicely over the last year, and the healthy balance sheet implies there is more potential for growth. The relatively low P/E ratio implies the market is pessimistic.
Investors have an opportunity when market expectations about a stock are wrong. If it is underestimating a company, investors can make money by buying and holding the shares until the market corrects itself. So this free visualization of the analyst consensus on future earnings could help you make the right decision about whether to buy, sell, or hold.
Of course you might be able to find a better stock than Western Alliance Bancorporation. So you may wish to see this free collection of other companies that have grown earnings strongly.
We aim to bring you long-term focused research analysis driven by fundamental data. Note that our analysis may not factor in the latest price-sensitive company announcements or qualitative material.
If you spot an error that warrants correction, please contact the editor at editorial-team@simplywallst.com. This article by Simply Wall St is general in nature. It does not constitute a recommendation to buy or sell any stock, and does not take account of your objectives, or your financial situation. Simply Wall St has no position in the stocks mentioned. Thank you for reading.
