Has Koninklijke Philips N.V. (AMS:PHIA) Been Employing Capital Shrewdly?

Today we'll look at Koninklijke Philips N.V. (AMS:PHIA) and reflect on its potential as an investment. In particular, we'll consider its Return On Capital Employed (ROCE), as that can give us insight into how profitably the company is able to employ capital in its business.
First, we'll go over how we calculate ROCE. Second, we'll look at its ROCE compared to similar companies. Last but not least, we'll look at what impact its current liabilities have on its ROCE.
Understanding Return On Capital Employed (ROCE)
ROCE is a measure of a company's yearly pre-tax profit (its return), relative to the capital employed in the business. All else being equal, a better business will have a higher ROCE. In brief, it is a useful tool, but it is not without drawbacks. Author Edwin Whiting says to be careful when comparing the ROCE of different businesses, since 'No two businesses are exactly alike.
How Do You Calculate Return On Capital Employed?
The formula for calculating the return on capital employed is:
Return on Capital Employed = Earnings Before Interest and Tax (EBIT) ÷ (Total Assets - Current Liabilities)
Or for Koninklijke Philips:
0.10 = €2.0b ÷ (€26b - €7.1b) (Based on the trailing twelve months to June 2019.)
So, Koninklijke Philips has an ROCE of 10%.
See our latest analysis for Koninklijke Philips
Does Koninklijke Philips Have A Good ROCE?
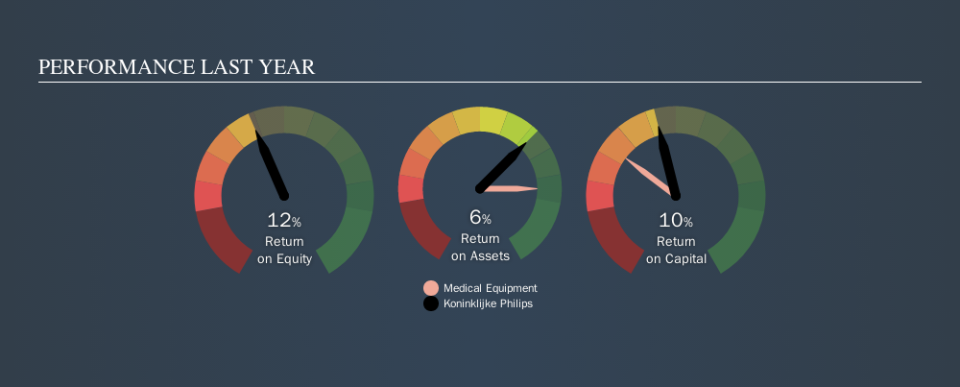
One way to assess ROCE is to compare similar companies. It appears that Koninklijke Philips's ROCE is fairly close to the Medical Equipment industry average of 12%. Separate from Koninklijke Philips's performance relative to its industry, its ROCE in absolute terms looks satisfactory, and it may be worth researching in more depth.
We can see that, Koninklijke Philips currently has an ROCE of 10% compared to its ROCE 3 years ago, which was 5.6%. This makes us think about whether the company has been reinvesting shrewdly. You can see in the image below how Koninklijke Philips's ROCE compares to its industry. Click to see more on past growth.
When considering ROCE, bear in mind that it reflects the past and does not necessarily predict the future. Companies in cyclical industries can be difficult to understand using ROCE, as returns typically look high during boom times, and low during busts. ROCE is only a point-in-time measure. Future performance is what matters, and you can see analyst predictions in our free report on analyst forecasts for the company.
How Koninklijke Philips's Current Liabilities Impact Its ROCE
Liabilities, such as supplier bills and bank overdrafts, are referred to as current liabilities if they need to be paid within 12 months. The ROCE equation subtracts current liabilities from capital employed, so a company with a lot of current liabilities appears to have less capital employed, and a higher ROCE than otherwise. To counter this, investors can check if a company has high current liabilities relative to total assets.
Koninklijke Philips has total assets of €26b and current liabilities of €7.1b. Therefore its current liabilities are equivalent to approximately 27% of its total assets. Current liabilities are minimal, limiting the impact on ROCE.
The Bottom Line On Koninklijke Philips's ROCE
With that in mind, Koninklijke Philips's ROCE appears pretty good. There might be better investments than Koninklijke Philips out there, but you will have to work hard to find them . These promising businesses with rapidly growing earnings might be right up your alley.
If you are like me, then you will not want to miss this free list of growing companies that insiders are buying.
We aim to bring you long-term focused research analysis driven by fundamental data. Note that our analysis may not factor in the latest price-sensitive company announcements or qualitative material.
If you spot an error that warrants correction, please contact the editor at editorial-team@simplywallst.com. This article by Simply Wall St is general in nature. It does not constitute a recommendation to buy or sell any stock, and does not take account of your objectives, or your financial situation. Simply Wall St has no position in the stocks mentioned. Thank you for reading.
