Should Marathon Petroleum Corporation (NYSE:MPC) Be Part Of Your Dividend Portfolio?

Dividend paying stocks like Marathon Petroleum Corporation (NYSE:MPC) tend to be popular with investors, and for good reason - some research suggests a significant amount of all stock market returns come from reinvested dividends. If you are hoping to live on the income from dividends, it's important to be a lot more stringent with your investments than the average punter.
In this case, Marathon Petroleum likely looks attractive to dividend investors, given its 3.5% dividend yield and eight-year payment history. It sure looks interesting on these metrics - but there's always more to the story . The company also returned around 6.1% of its market capitalisation to shareholders in the form of stock buybacks over the past year. There are a few simple ways to reduce the risks of buying Marathon Petroleum for its dividend, and we'll go through these below.
Explore this interactive chart for our latest analysis on Marathon Petroleum!
Payout ratios
Companies (usually) pay dividends out of their earnings. If a company is paying more than it earns, the dividend might have to be cut. So we need to form a view on if a company's dividend is sustainable, relative to its net profit after tax. Marathon Petroleum paid out 45% of its profit as dividends, over the trailing twelve month period. This is a medium payout level that leaves enough capital in the business to fund opportunities that might arise, while also rewarding shareholders. One of the risks is that management reinvests the retained capital poorly instead of paying a higher dividend.
We also measure dividends paid against a company's levered free cash flow, to see if enough cash was generated to cover the dividend. Marathon Petroleum paid out a conservative 34% of its free cash flow as dividends last year. It's positive to see that Marathon Petroleum's dividend is covered by both profits and cash flow, since this is generally a sign that the dividend is sustainable, and a lower payout ratio usually suggests a greater margin of safety before the dividend gets cut.
Is Marathon Petroleum's Balance Sheet Risky?
As Marathon Petroleum has a meaningful amount of debt, we need to check its balance sheet to see if the company might have debt risks. A quick check of its financial situation can be done with two ratios: net debt divided by EBITDA (earnings before interest, tax, depreciation and amortisation), and net interest cover. Net debt to EBITDA measures total debt load relative to company earnings (lower = less debt), while net interest cover measures the ability to pay interest on the debt (higher = greater ability to pay interest costs). Marathon Petroleum has net debt of 3.04 times its EBITDA, which is getting towards the limit of most investors' comfort zones. Judicious use of debt can enhance shareholder returns, but also adds to the risk if something goes awry.
We calculated its interest cover by measuring its earnings before interest and tax (EBIT), and dividing this by the company's net interest expense. Interest cover of 4.98 times its interest expense is starting to become a concern for Marathon Petroleum, and be aware that lenders may place additional restrictions on the company as well.
We update our data on Marathon Petroleum every 24 hours, so you can always get our latest analysis of its financial health, here.
Dividend Volatility
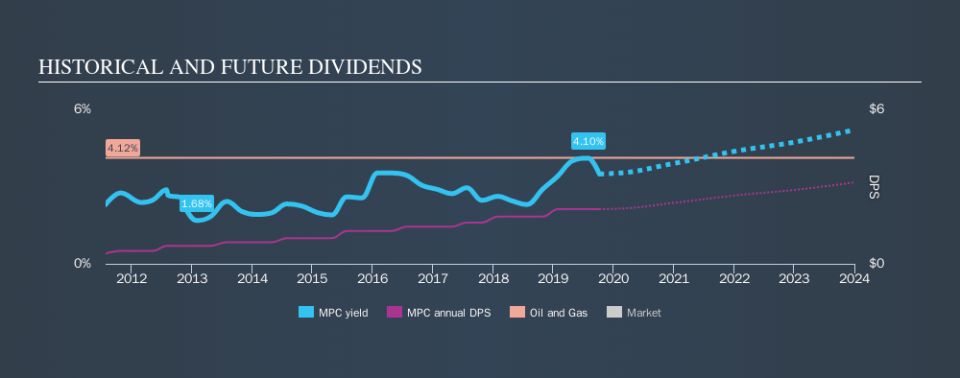
Before buying a stock for its income, we want to see if the dividends have been stable in the past, and if the company has a track record of maintaining its dividend. Looking at the last decade of data, we can see that Marathon Petroleum paid its first dividend at least eight years ago. The dividend has been quite stable over the past eight years, which is great to see - although we usually like to see the dividend maintained for a decade before giving it full marks, though. During the past eight-year period, the first annual payment was US$0.40 in 2011, compared to US$2.12 last year. Dividends per share have grown at approximately 23% per year over this time.
Marathon Petroleum has been growing its dividend quite rapidly, which is exciting. However, the short payment history makes us question whether this performance will persist across a full market cycle.
Dividend Growth Potential
While dividend payments have been relatively reliable, it would also be nice if earnings per share (EPS) were growing, as this is essential to maintaining the dividend's purchasing power over the long term. Marathon Petroleum has grown its earnings per share at 6.1% per annum over the past five years. It's good to see decent earnings growth and a low payout ratio. Companies with these characteristics often display the fastest dividend growth over the long term - assuming earnings can be maintained, of course.
Conclusion
Dividend investors should always want to know if a) a company's dividends are affordable, b) if there is a track record of consistent payments, and c) if the dividend is capable of growing. It's great to see that Marathon Petroleum is paying out a low percentage of its earnings and cash flow. Second, earnings growth has been ordinary, and its history of dividend payments is shorter than we'd like. Overall we think Marathon Petroleum is an interesting dividend stock, although it could be better.
Companies that are growing earnings tend to be the best dividend stocks over the long term. See what the 14 analysts we track are forecasting for Marathon Petroleum for free with public analyst estimates for the company.
We have also put together a list of global stocks with a market capitalisation above $1bn and yielding more 3%.
We aim to bring you long-term focused research analysis driven by fundamental data. Note that our analysis may not factor in the latest price-sensitive company announcements or qualitative material.
If you spot an error that warrants correction, please contact the editor at editorial-team@simplywallst.com. This article by Simply Wall St is general in nature. It does not constitute a recommendation to buy or sell any stock, and does not take account of your objectives, or your financial situation. Simply Wall St has no position in the stocks mentioned. Thank you for reading.
