Is MGM China Holdings Limited’s (HKG:2282) 7.6% ROCE Any Good?

Want to participate in a short research study? Help shape the future of investing tools and receive a $20 prize!
Today we’ll evaluate MGM China Holdings Limited (HKG:2282) to determine whether it could have potential as an investment idea. To be precise, we’ll consider its Return On Capital Employed (ROCE), as that will inform our view of the quality of the business.
First up, we’ll look at what ROCE is and how we calculate it. Second, we’ll look at its ROCE compared to similar companies. Then we’ll determine how its current liabilities are affecting its ROCE.
What is Return On Capital Employed (ROCE)?
ROCE measures the amount of pre-tax profits a company can generate from the capital employed in its business. In general, businesses with a higher ROCE are usually better quality. In brief, it is a useful tool, but it is not without drawbacks. Author Edwin Whiting says to be careful when comparing the ROCE of different businesses, since ‘No two businesses are exactly alike.’
How Do You Calculate Return On Capital Employed?
Analysts use this formula to calculate return on capital employed:
Return on Capital Employed = Earnings Before Interest and Tax (EBIT) ÷ (Total Assets – Current Liabilities)
Or for MGM China Holdings:
0.076 = HK$2.7b ÷ (HK$35b – HK$10b) (Based on the trailing twelve months to June 2018.)
Therefore, MGM China Holdings has an ROCE of 7.6%.
View our latest analysis for MGM China Holdings
Is MGM China Holdings’s ROCE Good?
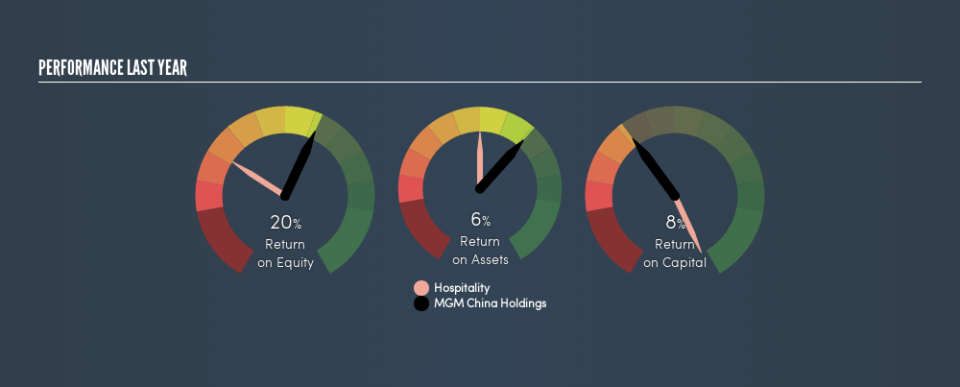
One way to assess ROCE is to compare similar companies. In our analysis, MGM China Holdings’s ROCE is meaningfully higher than the 5.2% average in the Hospitality industry. I think that’s good to see, since it implies the company is better than other companies at making the most of its capital. Separate from how MGM China Holdings stacks up against its industry, its ROCE in absolute terms is mediocre; relative to the returns on government bonds. Investors may wish to consider higher-performing investments.
MGM China Holdings’s current ROCE of 7.6% is lower than 3 years ago, when the company reported a 32% ROCE. This makes us wonder if the business is facing new challenges.
It is important to remember that ROCE shows past performance, and is not necessarily predictive. ROCE can be deceptive for cyclical businesses, as returns can look incredible in boom times, and terribly low in downturns. ROCE is, after all, simply a snap shot of a single year. What happens in the future is pretty important for investors, so we have prepared a free report on analyst forecasts for MGM China Holdings.
How MGM China Holdings’s Current Liabilities Impact Its ROCE
Liabilities, such as supplier bills and bank overdrafts, are referred to as current liabilities if they need to be paid within 12 months. The ROCE equation subtracts current liabilities from capital employed, so a company with a lot of current liabilities appears to have less capital employed, and a higher ROCE than otherwise. To check the impact of this, we calculate if a company has high current liabilities relative to its total assets.
MGM China Holdings has total assets of HK$35b and current liabilities of HK$10b. Therefore its current liabilities are equivalent to approximately 29% of its total assets. It is good to see a restrained amount of current liabilities, as this limits the effect on ROCE.
The Bottom Line On MGM China Holdings’s ROCE
With that in mind, we’re not overly impressed with MGM China Holdings’s ROCE, so it may not be the most appealing prospect. But note: MGM China Holdings may not be the best stock to buy. So take a peek at this free list of interesting companies with strong recent earnings growth (and a P/E ratio below 20).
If you like to buy stocks alongside management, then you might just love this free list of companies. (Hint: insiders have been buying them).
We aim to bring you long-term focused research analysis driven by fundamental data. Note that our analysis may not factor in the latest price-sensitive company announcements or qualitative material.
If you spot an error that warrants correction, please contact the editor at editorial-team@simplywallst.com. This article by Simply Wall St is general in nature. It does not constitute a recommendation to buy or sell any stock, and does not take account of your objectives, or your financial situation. Simply Wall St has no position in the stocks mentioned. On rare occasion, data errors may occur. Thank you for reading.
