What You Must Know About Aaron’s, Inc.’s (NYSE:AAN) Financial Health

Want to participate in a short research study? Help shape the future of investing tools and you could win a $250 gift card!
Small-cap and large-cap companies receive a lot of attention from investors, but mid-cap stocks like Aaron’s, Inc. (NYSE:AAN), with a market cap of US$3.5b, are often out of the spotlight. However, generally ignored mid-caps have historically delivered better risk adjusted returns than both of those groups. Let’s take a look at AAN’s debt concentration and assess their financial liquidity to get an idea of their ability to fund strategic acquisitions and grow through cyclical pressures. Remember this is a very top-level look that focuses exclusively on financial health, so I recommend a deeper analysis into AAN here.
See our latest analysis for Aaron’s
How much cash does AAN generate through its operations?
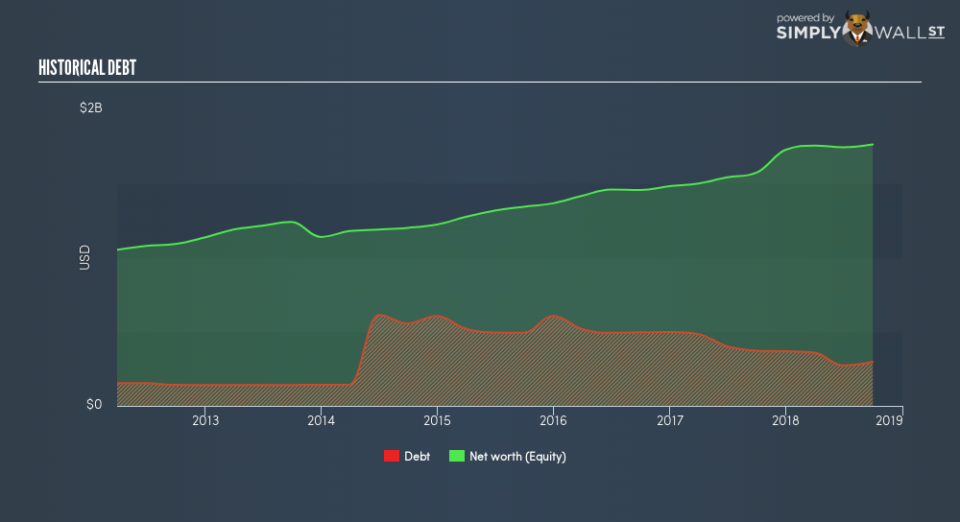
AAN’s debt levels have fallen from US$373m to US$297m over the last 12 months , which includes long-term debt. With this reduction in debt, AAN’s cash and short-term investments stands at US$35m for investing into the business. Additionally, AAN has generated US$342m in operating cash flow over the same time period, leading to an operating cash to total debt ratio of 115%, indicating that AAN’s operating cash is sufficient to cover its debt. This ratio can also be a sign of operational efficiency as an alternative to return on assets. In AAN’s case, it is able to generate 1.15x cash from its debt capital.
Can AAN meet its short-term obligations with the cash in hand?
Looking at AAN’s US$318m in current liabilities, it appears that the company has maintained a safe level of current assets to meet its obligations, with the current ratio last standing at 1.05x. Usually, for Specialty Retail companies, this is a suitable ratio since there’s a sufficient cash cushion without leaving too much capital idle or in low-earning investments.
Is AAN’s debt level acceptable?
With debt at 17% of equity, AAN may be thought of as appropriately levered. AAN is not taking on too much debt commitment, which can be restrictive and risky for equity-holders. We can check to see whether AAN is able to meet its debt obligations by looking at the net interest coverage ratio. A company generating earnings before interest and tax (EBIT) at least three times its net interest payments is considered financially sound. In AAN’s, case, the ratio of 29x suggests that interest is comfortably covered, which means that debtors may be willing to loan the company more money, giving AAN ample headroom to grow its debt facilities.
Next Steps:
AAN’s high cash coverage and low debt levels indicate its ability to utilise its borrowings efficiently in order to generate ample cash flow. Furthermore, the company exhibits proper management of current assets and upcoming liabilities. I admit this is a fairly basic analysis for AAN’s financial health. Other important fundamentals need to be considered alongside. I suggest you continue to research Aaron’s to get a better picture of the stock by looking at:
Future Outlook: What are well-informed industry analysts predicting for AAN’s future growth? Take a look at our free research report of analyst consensus for AAN’s outlook.
Valuation: What is AAN worth today? Is the stock undervalued, even when its growth outlook is factored into its intrinsic value? The intrinsic value infographic in our free research report helps visualize whether AAN is currently mispriced by the market.
Other High-Performing Stocks: Are there other stocks that provide better prospects with proven track records? Explore our free list of these great stocks here.
To help readers see past the short term volatility of the financial market, we aim to bring you a long-term focused research analysis purely driven by fundamental data. Note that our analysis does not factor in the latest price-sensitive company announcements.
The author is an independent contributor and at the time of publication had no position in the stocks mentioned. For errors that warrant correction please contact the editor at editorial-team@simplywallst.com.
