What You Must Know About Pepees SA.’s (WSE:PPS) 13.05% ROE

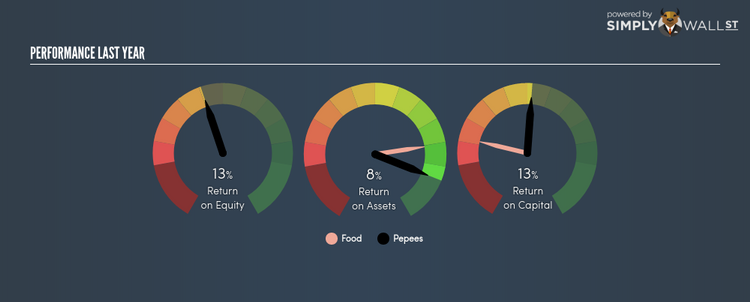
Pepees SA. (WSE:PPS) delivered a less impressive 13.05% ROE over the past year, compared to the 13.30% return generated by its industry. An investor may attribute an inferior ROE to a relatively inefficient performance, and whilst this can often be the case, knowing the nuts and bolts of the ROE calculation may change that perspective and give you a deeper insight into PPS’s past performance. Today I will look at how components such as financial leverage can influence ROE which may impact the sustainability of PPS’s returns. View our latest analysis for Pepees
What you must know about ROE
Firstly, Return on Equity, or ROE, is simply the percentage of last years’ earning against the book value of shareholders’ equity. For example, if the company invests PLN1 in the form of equity, it will generate PLN0.13 in earnings from this. While a higher ROE is preferred in most cases, there are several other factors we should consider before drawing any conclusions.
Return on Equity = Net Profit ÷ Shareholders Equity
ROE is measured against cost of equity in order to determine the efficiency of Pepees’s equity capital deployed. Its cost of equity is 8.67%. Pepees’s ROE exceeds its cost by 4.38%, which is a big tick. Some of its peers with higher ROE may face a cost which exceeds returns, which is unsustainable and far less desirable than Pepees’s case of positive discrepancy. ROE can be dissected into three distinct ratios: net profit margin, asset turnover, and financial leverage. This is called the Dupont Formula:
Dupont Formula
ROE = profit margin × asset turnover × financial leverage
ROE = (annual net profit ÷ sales) × (sales ÷ assets) × (assets ÷ shareholders’ equity)
ROE = annual net profit ÷ shareholders’ equity
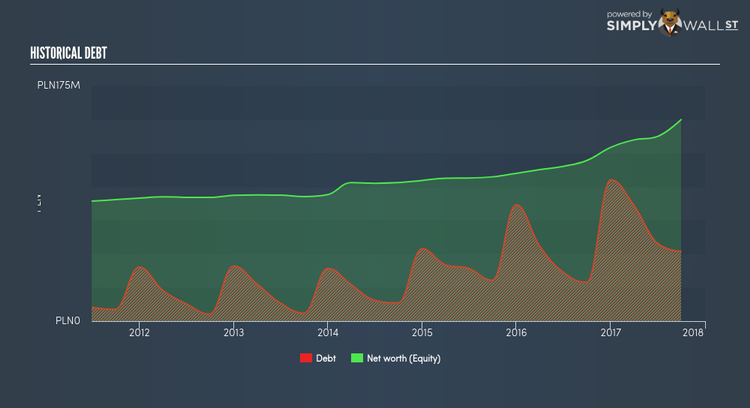
The first component is profit margin, which measures how much of sales is retained after the company pays for all its expenses. Asset turnover reveals how much revenue can be generated from Pepees’s asset base. The most interesting ratio, and reflective of sustainability of its ROE, is financial leverage. Since ROE can be inflated by excessive debt, we need to examine Pepees’s debt-to-equity level. At 34.71%, Pepees’s debt-to-equity ratio appears low and indicates that Pepees still has room to increase leverage and grow its profits.
Next Steps:
While ROE is a relatively simple calculation, it can be broken down into different ratios, each telling a different story about the strengths and weaknesses of a company. While Pepees exhibits a weak ROE against its peers, its returns are sufficient enough to cover its cost of equity. Its appropriate level of leverage means investors can be more confident in the sustainability of Pepees’s return with a possible increase should the company decide to increase its debt levels. Although ROE can be a useful metric, it is only a small part of diligent research.
For Pepees, I’ve put together three fundamental aspects you should further examine:
Financial Health: Does it have a healthy balance sheet? Take a look at our free balance sheet analysis with six simple checks on key factors like leverage and risk.
Future Earnings: How does Pepees’s growth rate compare to its peers and the wider market? Dig deeper into the analyst consensus number for the upcoming years by interacting with our free analyst growth expectation chart.
Other High-Growth Alternatives : Are there other high-growth stocks you could be holding instead of Pepees? Explore our interactive list of stocks with large growth potential to get an idea of what else is out there you may be missing!
To help readers see pass the short term volatility of the financial market, we aim to bring you a long-term focused research analysis purely driven by fundamental data. Note that our analysis does not factor in the latest price sensitive company announcements.
The author is an independent contributor and at the time of publication had no position in the stocks mentioned.
