What You Must Know About Rand Capital Corporation’s (RAND) Major Investors

Today, I will be analyzing Rand Capital Corporation’s (NASDAQ:RAND) recent ownership structure, an important but not-so-popular subject among individual investors. Ownership structure of a company has been found to affect share performance over time. Since the effect of an active institutional investor with a similar ownership as a passive pension-fund can be vastly different on a company’s corporate governance and accountability of shareholders, investors should take a closer look at XYZ’s shareholder registry. All data provided is as of the most recent financial year end.
View our latest analysis for Rand Capital

Institutional Ownership
In RAND’s case, institutional ownership stands at 12.75%, significant enough to cause considerable price moves in the case of large institutional transactions, especially when there is a low level of public shares available on the market to trade. However, as not all institutions are alike, such high volatility events, especially in the short-term, have been more frequently linked to active market participants like hedge funds. In the case of RAND, investors need not worry about such volatility considering active hedge funds don’t have a significant stake. However, we should dig deeper into RAND’s ownership structure and find out how other key ownership classes can affect its investment profile.
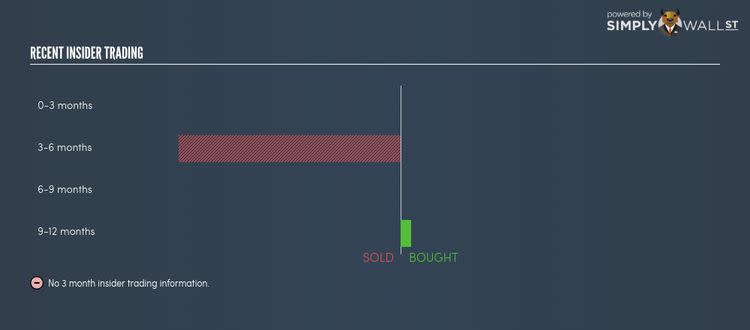
Insider Ownership
I find insiders are another important group of stakeholders, who are directly involved in making key decisions related to the use of capital. In essence, insider ownership is more about the alignment of shareholders’ interests with the management. RAND insiders hold a significant stake of 13.22% in the company. This level of insider ownership has been found to have a negative impact on companies with consistently low PE ratios (underperformers), while it has been positive in the case of high PE ratio firms (outperformers). It may be interesting to take a look at what company insiders have been doing with their holdings lately. Insiders buying company shares can be a positive indicator of future performance, but a selling decision can simply be driven by personal financial needs.
General Public Ownership
A substantial ownership of 74.03% in RAND is held by the general public. This size of ownership gives retail investors collective power in deciding on major policy decisions such as executive compensation, appointment of directors and acquisitions of businesses. This level of ownership gives retail investors the power to sway key policy decisions such as board composition, executive compensation, and potential acquisitions. This is a positive sign for an investor who wants to be involved in key decision-making of the company.
What this means for you:
Are you a shareholder? The company’s high institutional ownership makes margin of safety a very important consideration to existing investors since long bull and bear trends often emerge when these big-ticket investors see a change in long-term potential of the company. This will enable shareholders to comfortably invest in the company while avoid getting trapped in a sustained sell-off that is often observed in stocks with this level of institutional participation. If you’re interested in bolstering your portfolio with new stocks and are looking for ideas, take a look at our free app to see my list of stocks with a strong growth potential.
Are you a potential investor? If you are building an investment case for RAND, ownership structure alone should not dictate your decision to buy or sell the stock. Instead, you should be evaluating fundamental factors like the relative valuation of RAND, which is an important driver that determines RAND’s share price. Take a look at our most recent infographic report on RAND for a more in-depth analysis of these factors to help you make a more well-informed investment decision.
NB: Figures in this article are calculated using data from the last twelve months, which refer to the 12-month period ending on the last date of the month the financial statement is dated. This may not be consistent with full year annual report figures.
To help readers see pass the short term volatility of the financial market, we aim to bring you a long-term focused research analysis purely driven by fundamental data. Note that our analysis does not factor in the latest price sensitive company announcements.
The author is an independent contributor and at the time of publication had no position in the stocks mentioned.
