Navigant (NCI) Q1 Earnings Meet Estimates, Revenues Top


Navigant Consulting, Inc. NCI reported decent first-quarter 2018 results, wherein the company’s bottom line met the Zacks Consensus Estimate and the top line surpassed the same.
Adjusted earnings per share came in at 30 cents compared with 27 cents in the year-ago quarter. The bottom line benefitted from lower tax rates (as a result of Tax Cuts and Jobs Act) and reduced depreciation and amortization expenses.
Total revenues were $264.5 million compared with $257.8 million in the prior-year period. Revenues before reimbursements (RBR) were $243.9 million compared with $236.2 million in the prior-year period. Revenues before reimbursements beat the Zacks Consensus Estimate of $234 million. Strength across Energy, Financial, Risk & Compliance Advisory and Disputes, Forensics & Legal Technology segments drove top-line growth.
Navigant Consulting, Inc. Revenue (TTM)
Navigant Consulting, Inc. Revenue (TTM) | Navigant Consulting, Inc. Quote
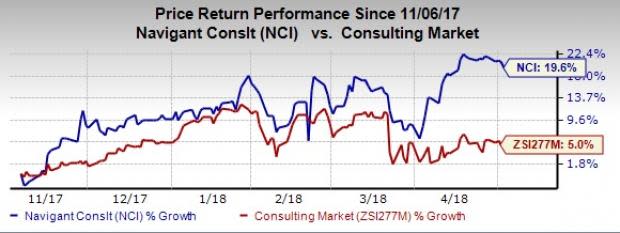
We observe that shares of Navigant have gained 19.6% in the past six months, outperforming the industry’s gain of 5%.
Revenues by Segment
Energy segment RBR increased 3.7% year over year to $33.7 million. Segment revenues were driven by higher demand from commercial client engagements for services such as grid modernization and distributed energy resource planning.
Financial Services Advisory and Compliance RBR increased 25.8% year over year to $41.4 million. Segment revenues were driven by increased activity in financial crime, sanctions, and operational efficiency engagements across its major clients.
Disputes, Forensics, and Legal Technology segment RBR increased 2.3% year over year to $78.6. Continuous demand for cyber security services and robust market for commercial disputes expertise drove the segment revenues.
Healthcare segment RBR decreased 4% year over year to $90.1 million. Reduced demand for large transformational engagements weighed on segment revenues.
Operating Results
Adjusted EBITDA in first-quarter 2018 came in at $29.9 million compared with $31.5 million in the prior-year quarter.
Operating income was $75.1 million compared with $74.4 million in the year-ago quarter. Depreciation expenses declined 8.4% year over year to $6,845 million. Amortization expenses declined 19.9% from the year-ago quarter to $1,856 million. General and administrative expenses rose 6.9% from the year-ago quarter to $44,362 million.
Operating margin (in terms of RBR) was 30.8% compared with 31.5% in the year-ago quarter.
Operating margin for Energy segment was 31.8% compared with 27.3% in the year-ago quarter. Operating margin for Financial Services Advisory and Compliance was 38.7% compared with 35.3% in the year-ago quarter. Operating margin for Disputes, Forensics, and Legal Technology was 35.5% compared with 33.2% in the year-ago quarter. Operating margin for Healthcare segment was 22.6% compared with 30.3% in the year-ago quarter.
Balance Sheet and Cash Flow
Navigant exited first-quarter 2018 with cash and cash equivalents of $6.65 million compared with $9.13 million in the year-ago quarter. As of Mar 31, 2018, bank debt was $184.3 million compared with $133 million at the end of December 2017. Leverage (bank debt divided by trailing 12-month adjusted EBITDA) was 1.48 compared with 1.06 as of Dec 31, 2017.
The company used $34.8 million of cash in operating activities in the reported quarter compared with $22.9 million in the year-ago quarter. Free cash flow was $20.1 million in the reported quarter compared with $13.3 million in the year-ago quarter.
During the reported quarter, the company repurchased almost 569,000 shares at an aggregate cost of $11.4 million and an average price of $19.95 per share.As of Mar 31, 2018, the company had $52.3 million available under its share repurchase authorization, which will expire on Dec 31, 2019.
2018 Outlook
Navigant reaffirmed its guidance for 2018.The company expects total revenues to be in the range of $1.030-$1.065 billion. Revenues before reimbursements are expected to be between $940 million and $975 million. The Zacks Consensus Estimate stands at $956.33 million, well within the guided range.
Current year earnings per share are expected to be between $1.26 and $1.44. The Zacks Consensus Estimate of $1.30 falls within the guided range.
Further, the companyexpects free cash flow between $75 million to $90 million. Adjusted EBITDA is anticipated in the range of $125 million to $137 million. Capital expenditures are estimated to be around $25 million.
Notably, the company expects to increase its RBR at an annual growth rate of 6-8% (on a organic basis) for the period 2018-2022.
Zacks Rank & Upcoming Releases
Navigant currently has a Zacks Rank #3 (Hold). You can see the complete list of today’s Zacks #1 Rank (Strong Buy) stocks here.
Investors interested in the broader Business Services sector are keenly awaiting earnings reports from key players like Gartner, Inc. IT, The Dun & Bradstreet Corp. DNB and Broadridge Financial Solutions Inc. BR. While Garter and Dun & Bradstreet will release first-quarter 2018 results on May 8 and May 9, respectively, Broadridge will report third-quarter fiscal 2018 numbers on May 8.
Today's Stocks from Zacks' Hottest Strategies
It's hard to believe, even for us at Zacks. But while the market gained +21.9% in 2017, our top stock-picking screens have returned +115.0%, +109.3%, +104.9%, +98.6%, and +67.1%.
And this outperformance has not just been a recent phenomenon. Over the years it has been remarkably consistent. From 2000 - 2017, the composite yearly average gain for these strategies has beaten the market more than 19X over. Maybe even more remarkable is the fact that we're willing to share their latest stocks with you without cost or obligation.
See Them Free>>
Want the latest recommendations from Zacks Investment Research? Today, you can download 7 Best Stocks for the Next 30 Days. Click to get this free report
Dun & Bradstreet Corporation (The) (DNB) : Free Stock Analysis Report
Gartner, Inc. (IT) : Free Stock Analysis Report
Navigant Consulting, Inc. (NCI) : Free Stock Analysis Report
Broadridge Financial Solutions, Inc. (BR) : Free Stock Analysis Report
To read this article on Zacks.com click here.
