Here’s What NCS Multistage Holdings, Inc.’s (NASDAQ:NCSM) P/E Is Telling Us

This article is written for those who want to get better at using price to earnings ratios (P/E ratios). To keep it practical, we’ll show how NCS Multistage Holdings, Inc.’s (NASDAQ:NCSM) P/E ratio could help you assess the value on offer. Based on the last twelve months, NCS Multistage Holdings’s P/E ratio is 26.56. That means that at current prices, buyers pay $26.56 for every $1 in trailing yearly profits.
Check out our latest analysis for NCS Multistage Holdings
Want to help shape the future of investing tools? Participate in a short research study and receive a subscription valued at $60.
How Do I Calculate A Price To Earnings Ratio?
The formula for price to earnings is:
Price to Earnings Ratio = Price per Share ÷ Earnings per Share (EPS)
Or for NCS Multistage Holdings:
P/E of 26.56 = $5.71 ÷ $0.22 (Based on the year to September 2018.)
Is A High P/E Ratio Good?
A higher P/E ratio means that buyers have to pay a higher price for each $1 the company has earned over the last year. All else being equal, it’s better to pay a low price — but as Warren Buffett said, ‘It’s far better to buy a wonderful company at a fair price than a fair company at a wonderful price.’
How Growth Rates Impact P/E Ratios
Companies that shrink earnings per share quickly will rapidly decrease the ‘E’ in the equation. That means even if the current P/E is low, it will increase over time if the share price stays flat. So while a stock may look cheap based on past earnings, it could be expensive based on future earnings.
It’s nice to see that NCS Multistage Holdings grew EPS by a stonking 90% in the last year. In contrast, EPS has decreased by 5.6%, annually, over 3 years.
How Does NCS Multistage Holdings’s P/E Ratio Compare To Its Peers?
We can get an indication of market expectations by looking at the P/E ratio. The image below shows that NCS Multistage Holdings has a higher P/E than the average (14.8) P/E for companies in the energy services industry.
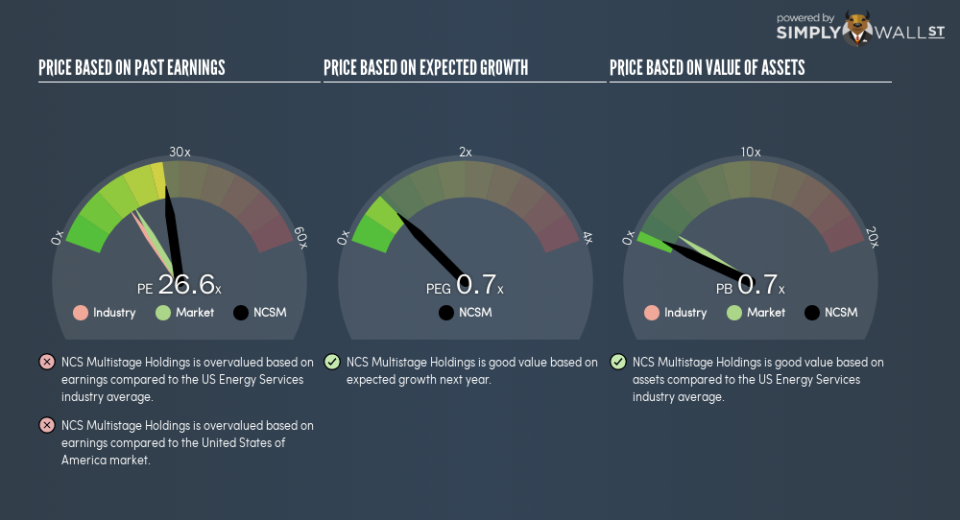
NCS Multistage Holdings’s P/E tells us that market participants think the company will perform better than its industry peers, going forward. Clearly the market expects growth, but it isn’t guaranteed. So investors should delve deeper. I like to check if company insiders have been buying or selling.
Remember: P/E Ratios Don’t Consider The Balance Sheet
It’s important to note that the P/E ratio considers the market capitalization, not the enterprise value. In other words, it does not consider any debt or cash that the company may have on the balance sheet. In theory, a company can lower its future P/E ratio by using cash or debt to invest in growth.
Such spending might be good or bad, overall, but the key point here is that you need to look at debt to understand the P/E ratio in context.
How Does NCS Multistage Holdings’s Debt Impact Its P/E Ratio?
The extra options and safety that comes with NCS Multistage Holdings’s US$1.9m net cash position means that it deserves a higher P/E than it would if it had a lot of net debt.
The Bottom Line On NCS Multistage Holdings’s P/E Ratio
NCS Multistage Holdings trades on a P/E ratio of 26.6, which is above the US market average of 16.7. With cash in the bank the company has plenty of growth options — and it is already on the right track. So it does not seem strange that the P/E is above average.
When the market is wrong about a stock, it gives savvy investors an opportunity. If the reality for a company is better than it expects, you can make money by buying and holding for the long term. So this free visual report on analyst forecasts could hold they key to an excellent investment decision.
Of course, you might find a fantastic investment by looking at a few good candidates. So take a peek at this free list of companies with modest (or no) debt, trading on a P/E below 20.
To help readers see past the short term volatility of the financial market, we aim to bring you a long-term focused research analysis purely driven by fundamental data. Note that our analysis does not factor in the latest price-sensitive company announcements.
The author is an independent contributor and at the time of publication had no position in the stocks mentioned. For errors that warrant correction please contact the editor at editorial-team@simplywallst.com.
