Are NN Inc’s (NASDAQ:NNBR) Interest Costs Too High?

While small-cap stocks, such as NN Inc (NASDAQ:NNBR) with its market cap of US$572.69m, are popular for their explosive growth, investors should also be aware of their balance sheet to judge whether the company can survive a downturn. So, understanding the company’s financial health becomes essential, as mismanagement of capital can lead to bankruptcies, which occur at a higher rate for small-caps. Here are a few basic checks that are good enough to have a broad overview of the company’s financial strength. Nevertheless, I know these factors are very high-level, so I recommend you dig deeper yourself into NNBR here.
Does NNBR produce enough cash relative to debt?
NNBR’s debt level has been constant at around US$808.09m over the previous year comprising of short- and long-term debt. At this stable level of debt, NNBR’s cash and short-term investments stands at US$224.45m for investing into the business. Moving onto cash from operations, its trivial cash flows from operations make the cash-to-debt ratio less useful to us, though these low levels of cash means that operational efficiency is worth a look. As the purpose of this article is a high-level overview, I won’t be looking at this today, but you can assess some of NNBR’s operating efficiency ratios such as ROA here.
Can NNBR pay its short-term liabilities?
At the current liabilities level of US$108.42m liabilities, it seems that the business has been able to meet these obligations given the level of current assets of US$477.28m, with a current ratio of 4.4x. However, anything about 3x may be excessive, since NNBR may be leaving too much capital in low-earning investments.
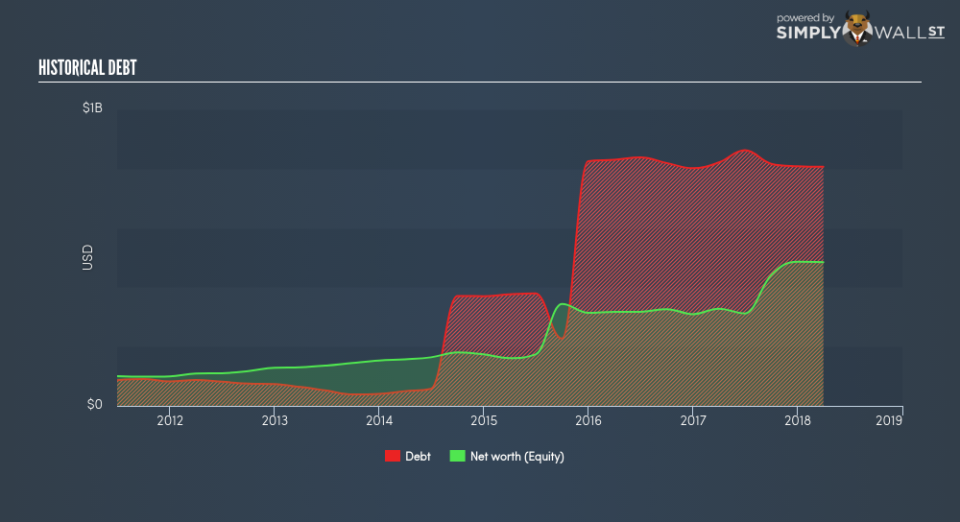
Does NNBR face the risk of succumbing to its debt-load?
Since total debt levels have outpaced equities, NNBR is a highly leveraged company. This is not uncommon for a small-cap company given that debt tends to be lower-cost and at times, more accessible. We can test if NNBR’s debt levels are sustainable by measuring interest payments against earnings of a company. Ideally, earnings before interest and tax (EBIT) should cover net interest by at least three times. For NNBR, the ratio of 0.55x suggests that interest is not strongly covered, which means that debtors may be less inclined to loan the company more money, reducing its headroom for growth through debt.
Next Steps:
NNBR’s cash flow coverage indicates it could improve its operating efficiency in order to meet demand for debt repayments should unforeseen events arise. However, the company exhibits an ability to meet its near term obligations should an adverse event occur. Keep in mind I haven’t considered other factors such as how NNBR has been performing in the past. I suggest you continue to research NN to get a more holistic view of the stock by looking at:
Future Outlook: What are well-informed industry analysts predicting for NNBR’s future growth? Take a look at our free research report of analyst consensus for NNBR’s outlook.
Valuation: What is NNBR worth today? Is the stock undervalued, even when its growth outlook is factored into its intrinsic value? The intrinsic value infographic in our free research report helps visualize whether NNBR is currently mispriced by the market.
Other High-Performing Stocks: Are there other stocks that provide better prospects with proven track records? Explore our free list of these great stocks here.
To help readers see pass the short term volatility of the financial market, we aim to bring you a long-term focused research analysis purely driven by fundamental data. Note that our analysis does not factor in the latest price sensitive company announcements.
The author is an independent contributor and at the time of publication had no position in the stocks mentioned.
