NZD/USD Tests July High; .8135 Break Could Complete Bottoming Pattern
4Hour
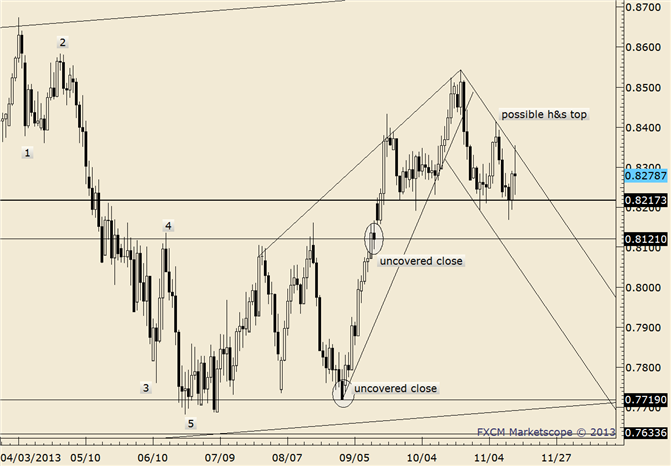
Chart Prepared by Jamie Saettele, CMT using Marketscope 2.0
Interested in automated trading with Mirror Trader?
FOREXAnalysis: “The NZDUSD has been consolidating since June 11th. It’s impossible to know if the consolidation leads to a reversal or continuation of longer term weakness but based on the corrective rally from the June low, it’s best to favor the downside until proven wrong.” Price came within 1 pip of the July high today before backing off. A push above .8135 would trigger an inverse head and shoulders.
FOREXTrading Strategy: Stopped out of short at .8060.
LEVELS: .7933 .7994 .8028 .8105 .8135 .8210
DailyFX provides forex news and technical analysis on the trends that influence the global currency markets.
Learn forex trading with a free practice account and trading charts from FXCM.
