Omeros, Mattel, And 3 Other Stocks In Clear Trending Patterns This Week
In light of Monday's volatility, here are five stocks to watch this week according to VantagePoint, a platform that uses artificial intelligence and Intermarket analysis to predict price movement.
What's On The Charts
Each candle on the following stock charts represents one day of trading action.
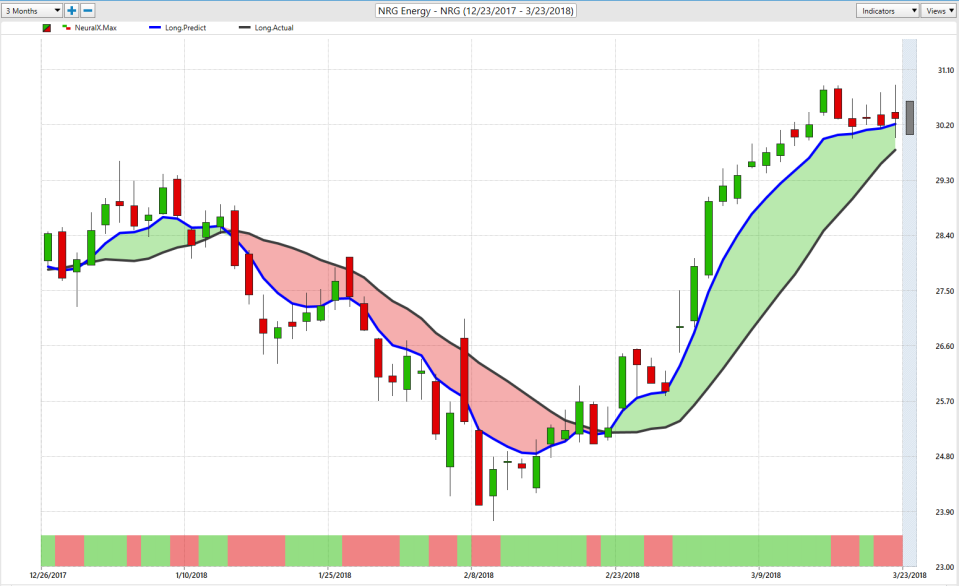
The black line on the chart is a simple 10-day moving average.
The blue line is generated via the AI in VantagePoint's intermarket analysis. It forecasts what the moving average will be 48 hours in advance.
As you can probably tell, shaded areas of the candle chart represent whether the stock is in an uptrend or downtrend.
A trend shift is represented by the two lines crossing. As long as the two lines don't cross, the current trend remains intact.
The red/green bar below the candle chart is a Neural Index. It determines whether a stock will move higher or lower in the coming two days.
This Week's Stocks To Watch NRG Energy
NRG Energy Inc (NYSE: NRG) had a predictive moving average crossover to the upside on Feb. 22, indicating a bullish trend. There was a bit of sideways movement very early on, but the stock has since broken out.
Omeros Corporation
Omeros Corporation (NASDAQ: OMER) also had a crossover to the upside in early March when that blue line made the cross above the black line. Since that crossover, the market was up almost 17 percent in 11 trading days.

Encore Wire
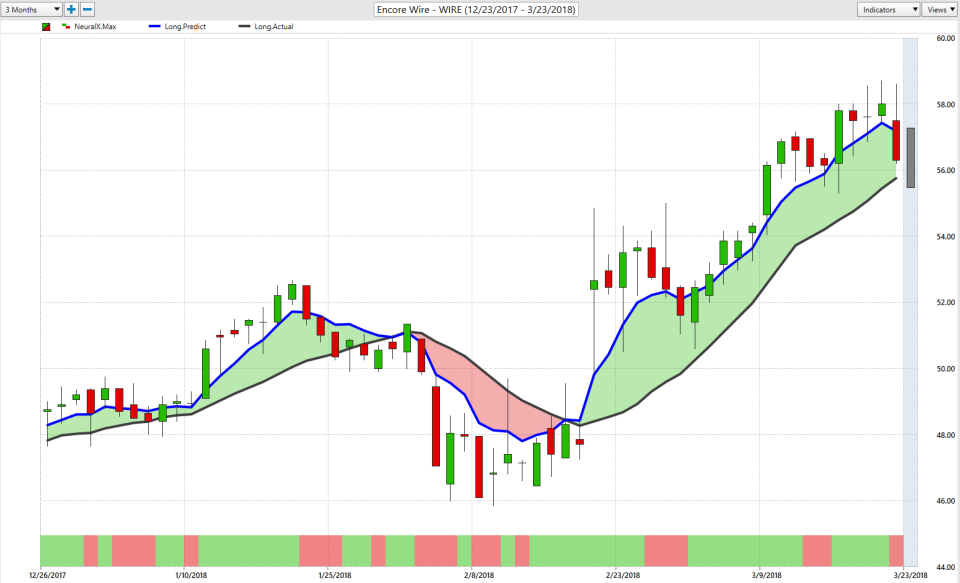
Encore Wire Corporation (NASDAQ: WIRE) follows the same general principle. It had a bullish crossover in mid –February and a huge gap up in late-February. The Neural Index also supported that move up. In 24 trading days, WIRE was up 22.54 percent, or $10.67 per share.
Mattel
Mattel, Inc. (NASDAQ: MAT) follows the same principle, but to the downside instead. That market had a bearish crossover in mid-February, and then had quite a bit of sideways movement. But traders knew they could begin shorting this market when the predictive indicators in VantagePoint indicated that crossover. Since that crossover of the blue line 22 trading days ago, the market was down 23 percent or $3.82 per share.

Tenet Healthcare
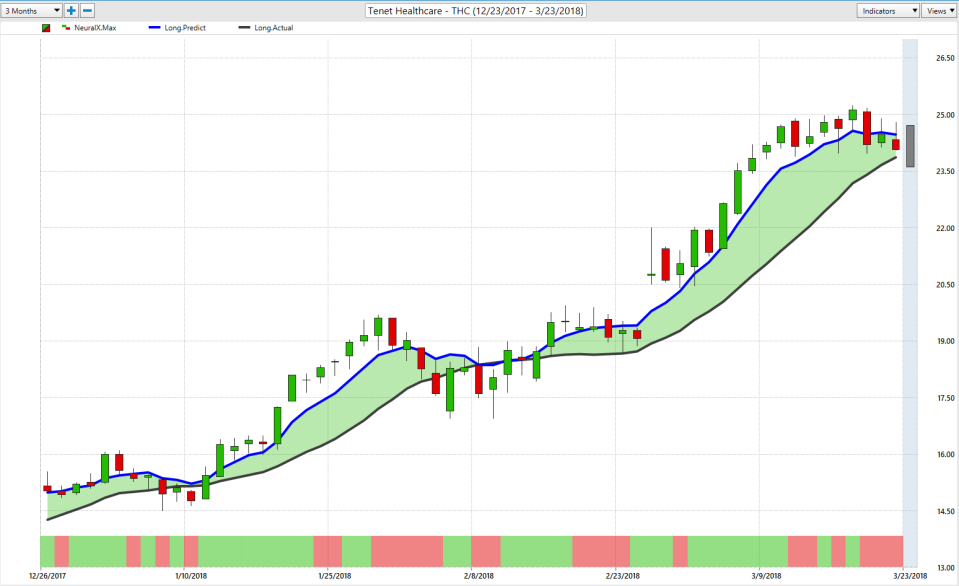
Lastly, we have Tenet Healthcare Corp (NYSE: THC) which had a bullish crossover in early-February. When the blue line crossed above the black line, that’s when traders new the trend was reversing and to ride that bullish wave. Since that crossover, the market was up over 32 percent in 26 trading days or $6.01 per share.
Watch the full Hot Stocks Outlook below
About the Hot Stocks Outlook
The Hot Stocks Outlook is a weekly series. It’s designed to show traders how improving their timing is the key to maximizing gains and minimizing losses. VantagePoint Trading Software identifies trend reversals with up to 86 percent accuracy, helping traders get into the right side of trades at just the right time.
VantagePoint is an editorial partner of Benzinga. For a free demo click here.
See more from Benzinga
Netflix Looks Like It's In For More Downside, And 4 Other Stocks To Watch This Week
After Hitting A New 52-Week High, HP Looks Primed For Downside
© 2018 Benzinga.com. Benzinga does not provide investment advice. All rights reserved.
