Is Otter Tail Corporation’s (NASDAQ:OTTR) High P/E Ratio A Problem For Investors?

Want to participate in a short research study? Help shape the future of investing tools and receive a $20 prize!
This article is for investors who would like to improve their understanding of price to earnings ratios (P/E ratios). We’ll look at Otter Tail Corporation’s (NASDAQ:OTTR) P/E ratio and reflect on what it tells us about the company’s share price. Otter Tail has a price to earnings ratio of 24.02, based on the last twelve months. That corresponds to an earnings yield of approximately 4.2%.
Check out our latest analysis for Otter Tail
How Do You Calculate A P/E Ratio?
The formula for P/E is:
Price to Earnings Ratio = Price per Share ÷ Earnings per Share (EPS)
Or for Otter Tail:
P/E of 24.02 = $49.94 ÷ $2.08 (Based on the trailing twelve months to December 2018.)
Is A High P/E Ratio Good?
A higher P/E ratio means that buyers have to pay a higher price for each $1 the company has earned over the last year. All else being equal, it’s better to pay a low price — but as Warren Buffett said, ‘It’s far better to buy a wonderful company at a fair price than a fair company at a wonderful price.’
How Growth Rates Impact P/E Ratios
P/E ratios primarily reflect market expectations around earnings growth rates. When earnings grow, the ‘E’ increases, over time. That means unless the share price increases, the P/E will reduce in a few years. So while a stock may look expensive based on past earnings, it could be cheap based on future earnings.
Otter Tail increased earnings per share by an impressive 13% over the last twelve months. And earnings per share have improved by 8.4% annually, over the last five years. So one might expect an above average P/E ratio.
How Does Otter Tail’s P/E Ratio Compare To Its Peers?
The P/E ratio indicates whether the market has higher or lower expectations of a company. The image below shows that Otter Tail has a higher P/E than the average (21.3) P/E for companies in the electric utilities industry.
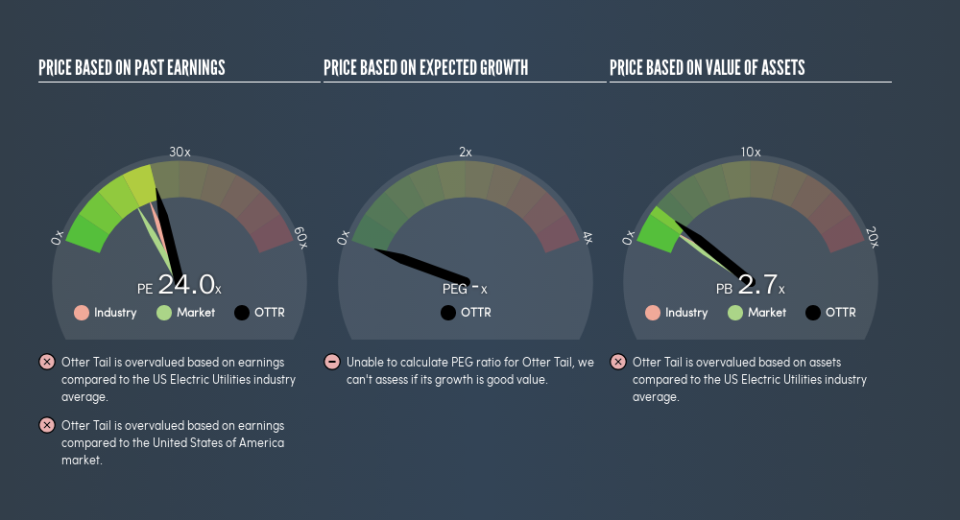
That means that the market expects Otter Tail will outperform other companies in its industry. Shareholders are clearly optimistic, but the future is always uncertain. So further research is always essential. I often monitor director buying and selling.
Remember: P/E Ratios Don’t Consider The Balance Sheet
The ‘Price’ in P/E reflects the market capitalization of the company. That means it doesn’t take debt or cash into account. Hypothetically, a company could reduce its future P/E ratio by spending its cash (or taking on debt) to achieve higher earnings.
Spending on growth might be good or bad a few years later, but the point is that the P/E ratio does not account for the option (or lack thereof).
Otter Tail’s Balance Sheet
Otter Tail’s net debt is 31% of its market cap. This is enough debt that you’d have to make some adjustments before using the P/E ratio to compare it to a company with net cash.
The Bottom Line On Otter Tail’s P/E Ratio
Otter Tail trades on a P/E ratio of 24, which is above the US market average of 17.5. Its debt levels do not imperil its balance sheet and it has already proven it can grow. So it does not seem strange that the P/E is above average.
Investors have an opportunity when market expectations about a stock are wrong. If the reality for a company is better than it expects, you can make money by buying and holding for the long term. Although we don’t have analyst forecasts, you might want to assess this data-rich visualization of earnings, revenue and cash flow.
But note: Otter Tail may not be the best stock to buy. So take a peek at this free list of interesting companies with strong recent earnings growth (and a P/E ratio below 20).
We aim to bring you long-term focused research analysis driven by fundamental data. Note that our analysis may not factor in the latest price-sensitive company announcements or qualitative material.
If you spot an error that warrants correction, please contact the editor at editorial-team@simplywallst.com. This article by Simply Wall St is general in nature. It does not constitute a recommendation to buy or sell any stock, and does not take account of your objectives, or your financial situation. Simply Wall St has no position in the stocks mentioned. Thank you for reading.
