Was Patrick Industries Inc’s (NASDAQ:PATK) Earnings Growth Better Than The Industry’s?

After looking at Patrick Industries Inc’s (NASDAQ:PATK) latest earnings announcement (01 April 2018), I found it useful to revisit the company’s performance in the past couple of years and assess this against the most recent figures. As a long-term investor I tend to focus on earnings trend, rather than a single number at one point in time. Also, comparing it against an industry benchmark to understand whether it outperformed, or is simply riding an industry wave, is a crucial aspect. Below is a brief commentary on my key takeaways. Check out our latest analysis for Patrick Industries
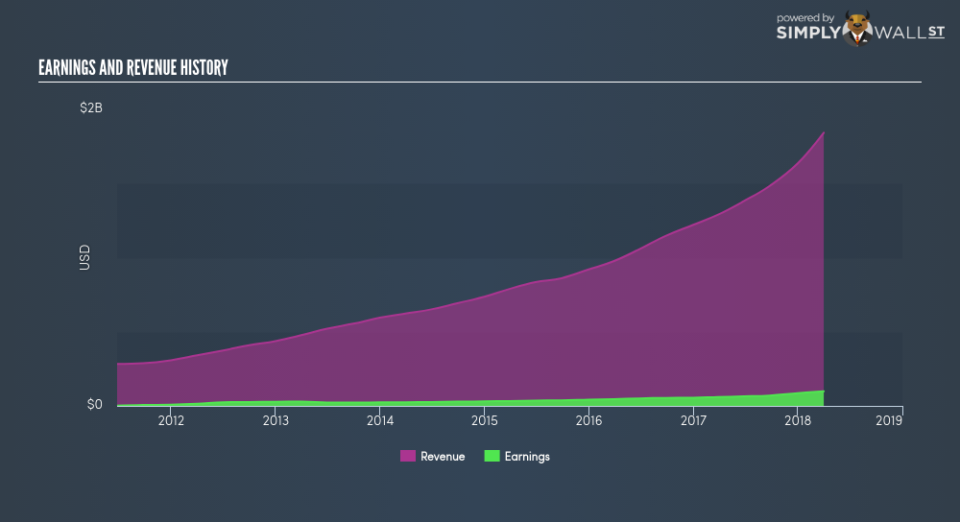
Were PATK’s earnings stronger than its past performances and the industry?
PATK’s trailing twelve-month earnings (from 01 April 2018) of US$98.32m has jumped 62.91% compared to the previous year. Furthermore, this one-year growth rate has exceeded its 5-year annual growth average of 27.81%, indicating the rate at which PATK is growing has accelerated. How has it been able to do this? Let’s take a look at if it is merely because of an industry uplift, or if Patrick Industries has experienced some company-specific growth.
Over the past couple of years, Patrick Industries increased its bottom line faster than revenue by efficiently controlling its costs. This resulted in a margin expansion and profitability over time. Looking at growth from a sector-level, the US building industry has been growing its average earnings by double-digit 15.18% in the past twelve months, and 15.68% over the past five. This means whatever tailwind the industry is deriving benefit from, Patrick Industries is capable of leveraging this to its advantage.
In terms of returns from investment, Patrick Industries has invested its equity funds well leading to a 24.23% return on equity (ROE), above the sensible minimum of 20%. Furthermore, its return on assets (ROA) of 10.63% exceeds the US Building industry of 7.41%, indicating Patrick Industries has used its assets more efficiently. However, its return on capital (ROC), which also accounts for Patrick Industries’s debt level, has declined over the past 3 years from 19.94% to 15.13%. This correlates with an increase in debt holding, with debt-to-equity ratio rising from 83.89% to 105.70% over the past 5 years.
What does this mean?
Patrick Industries’s track record can be a valuable insight into its earnings performance, but it certainly doesn’t tell the whole story. Companies that have performed well in the past, such as Patrick Industries gives investors conviction. However, the next step would be to assess whether the future looks as optimistic. You should continue to research Patrick Industries to get a better picture of the stock by looking at:
Future Outlook: What are well-informed industry analysts predicting for PATK’s future growth? Take a look at our free research report of analyst consensus for PATK’s outlook.
Financial Health: Is PATK’s operations financially sustainable? Balance sheets can be hard to analyze, which is why we’ve done it for you. Check out our financial health checks here.
Other High-Performing Stocks: Are there other stocks that provide better prospects with proven track records? Explore our free list of these great stocks here.
NB: Figures in this article are calculated using data from the trailing twelve months from 01 April 2018. This may not be consistent with full year annual report figures.
To help readers see pass the short term volatility of the financial market, we aim to bring you a long-term focused research analysis purely driven by fundamental data. Note that our analysis does not factor in the latest price sensitive company announcements.
The author is an independent contributor and at the time of publication had no position in the stocks mentioned.
