Policy Changes Cannot Stop Digital Turbine (NASDAQ:APPS)
This article first appeared on Simply Wall St News.
After an uneventful first half of the year, Digital Turbine, Inc. (NASDAQ: APPS) rallied, yet it once again failed to stay above the critical level of US$90. Yet, it seems like the high growth was priced in as it quickly retraced after the latest earnings. In this article, we will take a look into its current valuation.
View our latest analysis for Digital Turbine
Second-quarter 2022 results
Revenue: US$310.2m (up 338% from 2Q 2021)
Net loss: US$5.85m (down US$6.23m from profit in 2Q 2021)
Although earnings and control over costs were weaker, the company reported a decent second-quarter result with improved revenues. Over the last 3 years, on average, earnings per share have increased by 104% per year, but its share price has risen by 246% per year, which means it is tracking significantly ahead of earnings growth.
Although other companies in the ad-tech sector certainly suffered from Apple's Identifier for Advertisers (IDFA), this impact represented only 1% of the consolidated revenue for Digital Turbine, speaking of the company's diversification and vigilance.
Furthermore, the company is expanding partnerships with OEMs, strengthening the ties with AT&T, Verizon, and Samsung. CEO Bill Stone reflected on the positive results and remained optimistic about the future, quoting "a dramatically expanded market opportunity set in future quarters and years."
DCF Valuation Model
With the Discounted Cash Flow (DCF) model, we generally believe that a company's value is the present value of all cash it will generate in the future. However, a DCF is just one valuation metric among many, and it is not without flaws. For those keen learners of equity analysis, the Simply Wall St analysis model here may be something of interest to you.
Is Digital Turbine reasonably valued?
We use what is known as a 2-stage model, which means we have two different periods of growth rates for the company's cash flows. Generally, the first stage is higher growth, and the second stage is a lower growth phase. To begin with, we have to get estimates of the next ten years of cash flows.
Where possible, we use analyst estimates, but when these aren't available, we extrapolate the previous free cash flow (FCF) from the last estimate or reported value. We assume companies with shrinking free cash flow will slow their rate of shrinkage and that companies with growing free cash flow will see their growth rate slow over this period. We do this to reflect that growth tends to slow more early than in later years.
10-year free cash flow (FCF) forecast
2022 | 2023 | 2024 | 2025 | 2026 | 2027 | 2028 | 2029 | 2030 | 2031 | |
Levered FCF ($, Millions) | US$181.6m | US$293.0m | US$436.9m | US$550.2m | US$653.2m | US$742.7m | US$818.3m | US$881.4m | US$934.2m | US$978.8m |
Growth Rate Estimate Source | Analyst x1 | Analyst x1 | Analyst x1 | Est @ 25.92% | Est @ 18.73% | Est @ 13.7% | Est @ 10.18% | Est @ 7.71% | Est @ 5.99% | Est @ 4.78% |
Present Value ($, Millions) Discounted @ 6.4% | US$171 | US$259 | US$363 | US$430 | US$480 | US$513 | US$531 | US$538 | US$536 | US$528 |
("Est" = FCF growth rate estimated by Simply Wall St)
Present Value of 10-year Cash Flow (PVCF) = US$4.4b
After calculating the present value of future cash flows in the initial 10-year period, we need to calculate the Terminal Value, which accounts for all future cash flows beyond the first stage. The Gordon Growth formula is used to calculate Terminal Value at a future annual growth rate equal to the 5-year average of the 10-year government bond yield of 2.0%. We discount the terminal cash flows to today's value at the cost of equity of 6.4%.
Terminal Value (TV)= FCF2031 × (1 + g) ÷ (r – g) = US$979m× (1 + 2.0%) ÷ (6.4%– 2.0%) = US$23b
Present Value of Terminal Value (PVTV)= TV / (1 + r)10= US$23b÷ ( 1 + 6.4%)10= US$12b
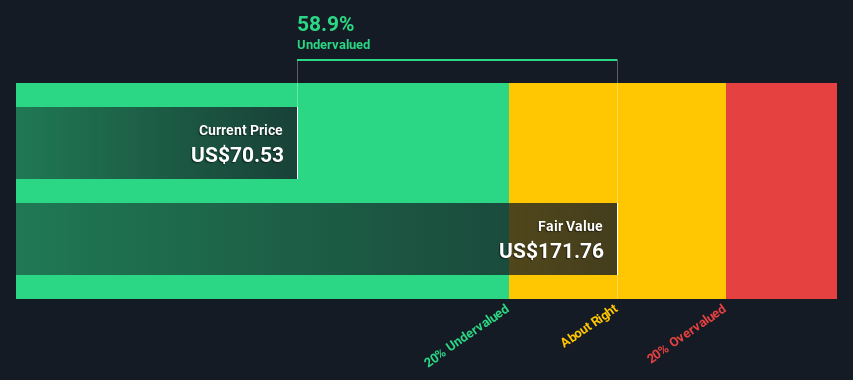
The total value is the sum of cash flows for the next ten years plus the discounted terminal value, which results in the Total Equity Value, which in this case is US$17b. The last step is to then divide the equity value by the number of shares outstanding. Relative to the current share price of US$70.5, the company appears potentially underpriced at a discount of over 50%.
This might sound concerning, and we recommend potential investors dig deeper. What is going on here to cause the market to undervalue the stock so much? Valuations are imprecise instruments though, do keep this in mind.
Important assumptions
Now the most important inputs to a discounted cash flow are the discount rate, and of course, the actual cash flows. The DCF does not consider the possible cyclicality of an industry or its future capital requirements, so it does not give a complete picture of a company's potential performance.
Given that we are looking at Digital Turbine as potential shareholders, the cost of equity is used as the discount rate rather than the cost of capital (or the weighted average cost of capital, WACC), which accounts for debt. We've used 6.4% in this calculation, which is based on a levered beta of 1.004. Beta is a measure of a stock's volatility compared to the market as a whole. We get our beta from the industry average beta of globally comparable companies, with an imposed limit between 0.8 and 2.0, a reasonable range for a stable business.
Moving On:
Despite 60%+ growth and strong guidance, Digital Turbine found no love after these earnings, especially after they proved to have the latest policy shift effects under full control. From our standpoint, it seems that the stock is getting dragged down by the broad sector panic.
Yet, the DCF model is not a perfect stock valuation tool. Instead, the best use for a DCF model is to test certain assumptions and theories to see if they would lead to the company being undervalued or overvalued. For instance, if the terminal value growth rate is adjusted slightly, it can dramatically alter the overall result.
For Digital Turbine, there are three additional aspects you should explore:
Risks: Take risks, for example - Digital Turbine has 5 warning signs (and 1 which is a bit unpleasant) we think you should know about.
Future Earnings: How does APPS's growth rate compare to its peers and the broader market? Dig deeper into the analyst consensus number for the upcoming years by interacting with our free analyst growth expectation chart.
Other Solid Businesses: Low debt, high returns on equity, and good past performance are fundamental to a strong business. Why not explore our interactive list of stocks with solid business fundamentals to see if there are other companies you may not have considered!
PS. Simply Wall St updates its DCF calculation for every American stock every day, so if you want to find the intrinsic value of any other stock, search here.
Simply Wall St analyst Stjepan Kalinic and Simply Wall St have no position in any of the companies mentioned. This article is general in nature. We provide commentary based on historical data and analyst forecasts only using an unbiased methodology and our articles are not intended to be financial advice. It does not constitute a recommendation to buy or sell any stock and does not take account of your objectives, or your financial situation. We aim to bring you long-term focused analysis driven by fundamental data. Note that our analysis may not factor in the latest price-sensitive company announcements or qualitative material.
Have feedback on this article? Concerned about the content? Get in touch with us directly. Alternatively, email editorial-team@simplywallst.com
