Is Probiotec Limited's (ASX:PBP) Recent Stock Performance Influenced By Its Financials In Any Way?
Most readers would already know that Probiotec's (ASX:PBP) stock increased by 2.9% over the past week. We wonder if and what role the company's financials play in that price change as a company's long-term fundamentals usually dictate market outcomes. In this article, we decided to focus on Probiotec's ROE.
ROE or return on equity is a useful tool to assess how effectively a company can generate returns on the investment it received from its shareholders. In other words, it is a profitability ratio which measures the rate of return on the capital provided by the company's shareholders.
View our latest analysis for Probiotec
How Is ROE Calculated?
The formula for return on equity is:
Return on Equity = Net Profit (from continuing operations) ÷ Shareholders' Equity
So, based on the above formula, the ROE for Probiotec is:
8.8% = AU$5.9m ÷ AU$66m (Based on the trailing twelve months to December 2020).
The 'return' is the yearly profit. That means that for every A$1 worth of shareholders' equity, the company generated A$0.09 in profit.
What Is The Relationship Between ROE And Earnings Growth?
So far, we've learned that ROE is a measure of a company's profitability. Based on how much of its profits the company chooses to reinvest or "retain", we are then able to evaluate a company's future ability to generate profits. Assuming everything else remains unchanged, the higher the ROE and profit retention, the higher the growth rate of a company compared to companies that don't necessarily bear these characteristics.
Probiotec's Earnings Growth And 8.8% ROE
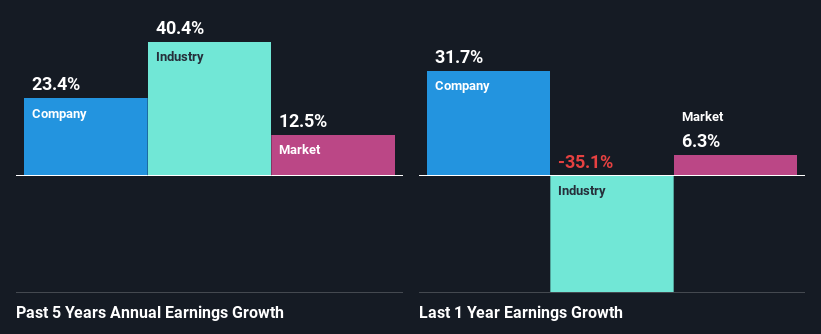
On the face of it, Probiotec's ROE is not much to talk about. Yet, a closer study shows that the company's ROE is similar to the industry average of 9.4%. Looking at Probiotec's exceptional 23% five-year net income growth in particular, we are definitely impressed. Considering the moderately low ROE, it is quite possible that there might be some other aspects that are positively influencing the company's earnings growth. Such as - high earnings retention or an efficient management in place.
Next, on comparing Probiotec's net income growth with the industry, we found that the company's reported growth is similar to the industry average growth rate of 20% in the same period.
Earnings growth is an important metric to consider when valuing a stock. What investors need to determine next is if the expected earnings growth, or the lack of it, is already built into the share price. By doing so, they will have an idea if the stock is headed into clear blue waters or if swampy waters await. Is Probiotec fairly valued compared to other companies? These 3 valuation measures might help you decide.
Is Probiotec Efficiently Re-investing Its Profits?
Probiotec has a significant three-year median payout ratio of 56%, meaning the company only retains 44% of its income. This implies that the company has been able to achieve high earnings growth despite returning most of its profits to shareholders.
Besides, Probiotec has been paying dividends for at least ten years or more. This shows that the company is committed to sharing profits with its shareholders. Our latest analyst data shows that the future payout ratio of the company over the next three years is expected to be approximately 50%. Still, forecasts suggest that Probiotec's future ROE will rise to 19% even though the the company's payout ratio is not expected to change by much.
Conclusion
In total, it does look like Probiotec has some positive aspects to its business. That is, quite an impressive growth in earnings. However, the low profit retention means that the company's earnings growth could have been higher, had it been reinvesting a higher portion of its profits. Having said that, looking at the current analyst estimates, we found that the company's earnings are expected to gain momentum. To know more about the latest analysts predictions for the company, check out this visualization of analyst forecasts for the company.
This article by Simply Wall St is general in nature. It does not constitute a recommendation to buy or sell any stock, and does not take account of your objectives, or your financial situation. We aim to bring you long-term focused analysis driven by fundamental data. Note that our analysis may not factor in the latest price-sensitive company announcements or qualitative material. Simply Wall St has no position in any stocks mentioned.
Have feedback on this article? Concerned about the content? Get in touch with us directly. Alternatively, email editorial-team (at) simplywallst.com.
