The Procter & Gamble Company's (NYSE:PG) Has Had A Decent Run On The Stock market: Are Fundamentals In The Driver's Seat?
Most readers would already know that Procter & Gamble's (NYSE:PG) stock increased by 4.6% over the past month. Given that stock prices are usually aligned with a company's financial performance in the long-term, we decided to investigate if the company's decent financials had a hand to play in the recent price move. In this article, we decided to focus on Procter & Gamble's ROE.
Return on Equity or ROE is a test of how effectively a company is growing its value and managing investors’ money. Put another way, it reveals the company's success at turning shareholder investments into profits.
See our latest analysis for Procter & Gamble
How Do You Calculate Return On Equity?
Return on equity can be calculated by using the formula:
Return on Equity = Net Profit (from continuing operations) ÷ Shareholders' Equity
So, based on the above formula, the ROE for Procter & Gamble is:
31% = US$14b ÷ US$46b (Based on the trailing twelve months to September 2021).
The 'return' is the amount earned after tax over the last twelve months. That means that for every $1 worth of shareholders' equity, the company generated $0.31 in profit.
What Has ROE Got To Do With Earnings Growth?
We have already established that ROE serves as an efficient profit-generating gauge for a company's future earnings. We now need to evaluate how much profit the company reinvests or "retains" for future growth which then gives us an idea about the growth potential of the company. Generally speaking, other things being equal, firms with a high return on equity and profit retention, have a higher growth rate than firms that don’t share these attributes.
A Side By Side comparison of Procter & Gamble's Earnings Growth And 31% ROE
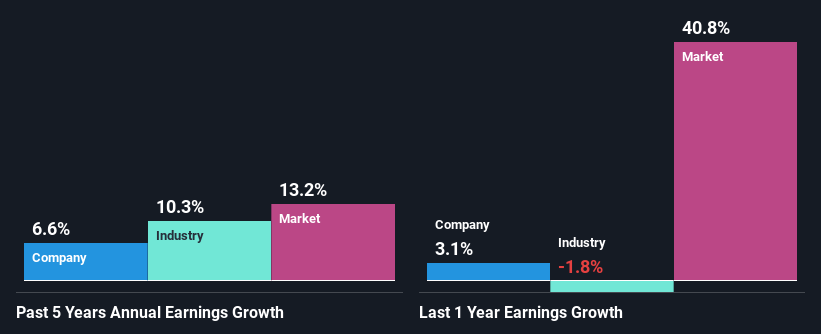
First thing first, we like that Procter & Gamble has an impressive ROE. Additionally, the company's ROE is higher compared to the industry average of 22% which is quite remarkable. This probably laid the groundwork for Procter & Gamble's moderate 6.6% net income growth seen over the past five years.
We then compared Procter & Gamble's net income growth with the industry and found that the company's growth figure is lower than the average industry growth rate of 10% in the same period, which is a bit concerning.
Earnings growth is a huge factor in stock valuation. What investors need to determine next is if the expected earnings growth, or the lack of it, is already built into the share price. Doing so will help them establish if the stock's future looks promising or ominous. What is PG worth today? The intrinsic value infographic in our free research report helps visualize whether PG is currently mispriced by the market.
Is Procter & Gamble Making Efficient Use Of Its Profits?
While Procter & Gamble has a three-year median payout ratio of 67% (which means it retains 33% of profits), the company has still seen a fair bit of earnings growth in the past, meaning that its high payout ratio hasn't hampered its ability to grow.
Besides, Procter & Gamble has been paying dividends for at least ten years or more. This shows that the company is committed to sharing profits with its shareholders. Our latest analyst data shows that the future payout ratio of the company over the next three years is expected to be approximately 57%. Accordingly, forecasts suggest that Procter & Gamble's future ROE will be 36% which is again, similar to the current ROE.
Conclusion
Overall, we feel that Procter & Gamble certainly does have some positive factors to consider. Its earnings growth is decent, and the high ROE does contribute to that growth. However, investors could have benefitted even more from the high ROE, had the company been reinvesting more of its earnings. Having said that, the company's earnings growth is expected to slow down, as forecasted in the current analyst estimates. To know more about the company's future earnings growth forecasts take a look at this free report on analyst forecasts for the company to find out more.
This article by Simply Wall St is general in nature. We provide commentary based on historical data and analyst forecasts only using an unbiased methodology and our articles are not intended to be financial advice. It does not constitute a recommendation to buy or sell any stock, and does not take account of your objectives, or your financial situation. We aim to bring you long-term focused analysis driven by fundamental data. Note that our analysis may not factor in the latest price-sensitive company announcements or qualitative material. Simply Wall St has no position in any stocks mentioned.
Have feedback on this article? Concerned about the content? Get in touch with us directly. Alternatively, email editorial-team (at) simplywallst.com.
